
Center of Dilation (7) – Dynamic Demonstration of Dilation Transformation
Loading the math board and drawing, please wait…
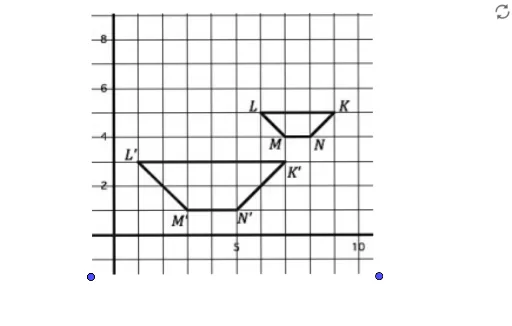
This GeoGebra example dynamically demonstrates the concept of the center of dilation in a dilation (homothety) transformation. It shows how a figure, composed of points A, B, and an embedded image pic1, is scaled with respect to a given center, illustrating the relationship between original and image points, which lie on lines passing through the center. The core mathematical concept is dilation (central scaling), involving scale factor, collinearity of corresponding points with the center, and similarity. Construction highlights: using GeoGebra point objects A and B, and an image object pic1, the center of dilation is defined and can be dragged to observe changes in the scaled figure; commands include creating points and embedding images, possibly with sliders for dynamic adjustment. Suitable for middle-to-high school students learning geometric transformations, and for teachers to demonstrate the connection between dilation and similarity, enhancing spatial reasoning and transformation understanding.
GeoGebra Commands & Parameters
Point A(-4.5, -3.11)Point B(3.36, -3.09)
AI Drawing Prompt Reference
Create a dynamic geometric diagram illustrating a dilation (homothety) transformation. Place two points in the lower-left and lower-right areas of a coordinate plane, roughly forming a horizontal segment. Embed an image as the original figure based on these points. Define a draggable center of dilation, and scale the image and the two points about this center by a variable factor, producing corresponding image points. Ensure that each original point, its image, and the center are collinear. The scale factor should be adjustable, clearly showing the similarity between the original and transformed figures. Suitable for middle school geometry instruction.
The prompt above was compiled from the original drawing commands and is for reference only.