
Binomial Distribution Probability and Bar Chart
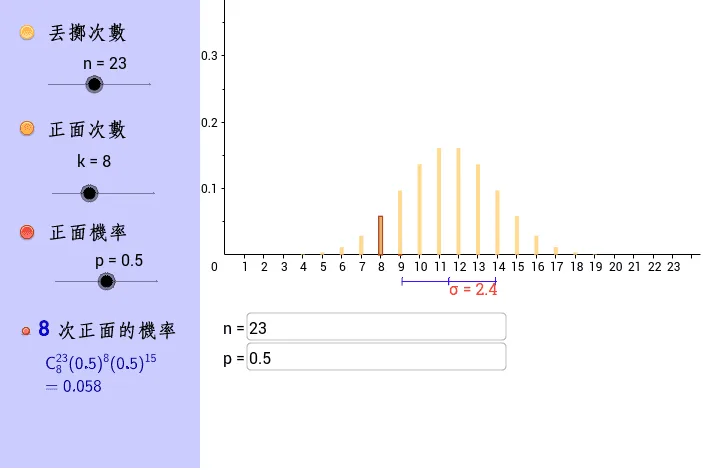
This GeoGebra applet dynamically demonstrates the probability calculation and visualization of the binomial distribution, serving as an interactive tool for exploring discrete random variables. Users can manipulate two primary parameters using intuitive sliders: the total number of independent trials, denoted as n, and the probability of success in a single trial, denoted as p. As these values are adjusted, the applet instantly updates a comprehensive bar chart that represents the probability mass function of the binomial distribution. Each bar corresponds to the exact probability of achieving a specific number of successes out of the total trials. In addition to the graphical representation, the applet automatically calculates and displays key statistical measures in real time. Specifically, it shows the expected value, or mean, and the standard deviation. This allows learners to see the direct mathematical relationship between the chosen parameters and the central tendency and dispersion of the data. By interacting with the sliders, students can observe how the shape of the distribution changes under different conditions. For instance, they can visually verify that the distribution is perfectly symmetric when the probability of success is exactly 0.5, and becomes noticeably skewed when the probability approaches 0 or 1. Furthermore, increasing the number of trials demonstrates how the distribution spreads out and begins to approximate a normal curve, providing a foundational understanding of the normal approximation to the binomial distribution. This model intuitively illustrates the probability distribution laws governing discrete random variables, making it an invaluable resource for high school and introductory college probability and statistics courses. It bridges the gap between abstract algebraic formulas and concrete graphical interpretations, empowering students to build a deep, intuitive grasp of binomial probabilities, expected outcomes, and statistical variability without getting bogged down by tedious manual calculations. Teachers can use this applet to pose dynamic what-if scenarios, encouraging active learning and deeper conceptual engagement during lessons on statistical inference and probability theory.
Loading the math board and drawing, please wait…