
Arithmetic Mean Calculation Practice
Loading the math board and drawing, please wait…
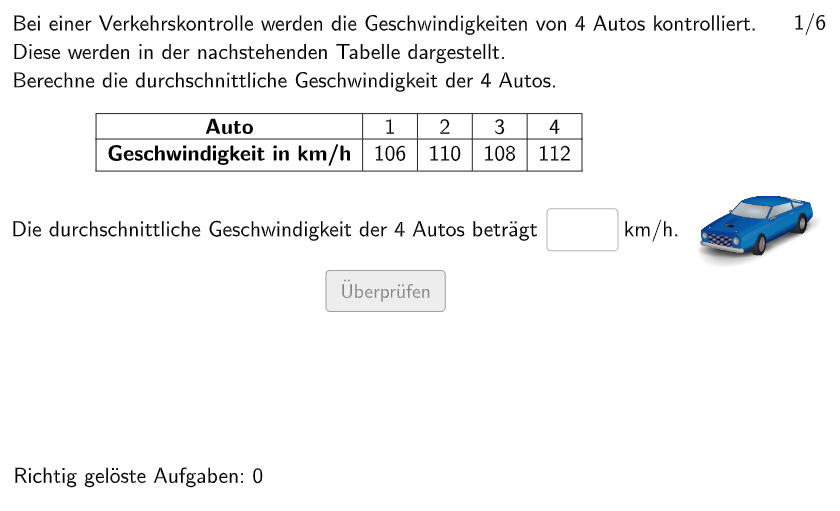
This is an interactive statistics exercise demonstrating how to calculate the arithmetic mean (average) of a set of data. The core mathematical concept involves the definition and formula of arithmetic mean: sum all values and divide by the count of values. Construction highlights: Using GeoGebra's Textfield command to create input boxes for data collection, Shuffle command to randomize data order, Append and Remove commands to dynamically add or remove data elements, Element command to extract specific positioned values, and Polygon command to visualize data distribution. Suitable for grade 5-6 students (approximately ages 10-12) in the German school system, or as introductory statistics teaching material to help students master basic skills in data collection, calculation, and interpretation of averages.
GeoGebra Commands & Parameters
Textfield(input1) → InputBox1Textfield(input2) → InputBox2Polygon(PtopLeftCornerFeedback, PtopRightCornerFeedback, PbottomRightCornerFeedback, PbottomLeftCornerFeedback) → rectangleCorrect, rectangleCorrectS3, rectangleCorrectS4, rectangleCorrectS2, rectangleCorrectS1Shuffle(Sequence[Random[0, 10], i, 1, 100]) → randomNosForX, {1, 1, 8, 6, 8, 3, 0, 3, 0, 5, 0, 6, 10, 1, 2, 4, 10, 8, 9, 4, 7, 5, 9, 4, 0, 1, 0, 6, 5, 5, 8, 7, 2, 2, 1, 3, 0, 3, 10, 6, 2, 7, 8, 9, 2, 8, 6, 4, 2, 3, 1, 5, 0, 1, 3, 9, 2, 0, 8, 1, 0, 9, 7, 10, 5, 8, 9, 7, 4, 3, 4, 2, 3, 7, 2, 4, 4, 3, 0, 10, 8, 9, 6, 10, 10, 5, 6, 3, 5, 3, 8, 6, 2, 0, 1, 2, 6, 0, 7, 9}Element(randomNosForX, Mod[questionCount, 100] + 1) → numXShuffle(Sequence[Random[0, 10], i, 1, 100]) → randomNosForY, {6, 8, 0, 9, 9, 3, 4, 1, 9, 6, 9, 5, 10, 10, 5, 0, 10, 9, 8, 7, 5, 6, 10, 7, 3, 8, 1, 7, 3, 7, 6, 4, 4, 3, 3, 7, 7, 0, 4, 1, 6, 10, 3, 6, 1, 1, 2, 2, 3, 5, 8, 2, 0, 9, 10, 1, 0, 2, 3, 10, 10, 0, 3, 4, 9, 6, 5, 10, 0, 1, 8, 2, 0, 4, 3, 4, 0, 8, 8, 9, 5, 9, 2, 2, 8, 5, 3, 8, 8, 8, 1, 7, 0, 6, 3, 5, 0, 9, 2, 5}Element(randomNosForY, Mod[questionCount, 100] + 1) → numYAppend(true, Sequence[If[randomNosForX(i) ≟ randomNosForX(i - 1), false, true], i, 2, 100]) → stayXAppend(true, Sequence[If[randomNosForY(i) ≟ randomNosForY(i - 1), false, true], i, 2, 100]) → stayYRemove(Sequence[If[stayX(i), randomNosForX(i), 0], i, 1, 100], Sequence[0, i, 1, 100]) → randomNosForXwithoutRepeatRemove(Sequence[If[stayY(i), randomNosForY(i), 0], i, 1, 100], Sequence[0, i, 1, 100]) → randomNosForYwithoutRepeatElement(randomNosForXwithoutRepeat, Mod[questionCount, Length[randomNosForXwithoutRepeat]] + 1) → numXwithoutRepeatElement(randomNosForYwithoutRepeat, Mod[questionCount, Length[randomNosForYwithoutRepeat]] + 1) → numYwithoutRepeatTextfield(input3) → InputBox3Textfield(input4) → InputBox4Textfield(input5) → InputBox5Textfield(input6) → InputBox6
AI Drawing Prompt Reference
Create an interactive statistics exercise showing how to calculate the arithmetic mean of a set of data. Include input boxes for data collection, randomize data order, dynamically add or remove data elements, extract specific positioned values, and use a polygon to visualize data distribution. First draw a rectangle, then generate two random sequences of data, remove duplicates, select specific data points, and finally display the data distribution using a polygon.
The prompt above was compiled from the original drawing commands and is for reference only.