
Area and Perimeter of Rectangles: Dynamic Construction and Measurement
Loading the math board and drawing, please wait…
In collections
Area, perimeter and volume of shapes
Area and Surface Area
Area and Surface Area
Area, Perimeter and Volume of shapes
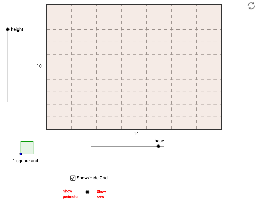
This GeoGebra example demonstrates the dynamic construction of rectangles to visualize how area and perimeter change with side lengths. Core mathematical concepts include the rectangle area formula (length × width), perimeter formula (2 × (length + width)), polygon properties, and coordinate-plane measurement. The construction uses GeoGebra commands such as Polygon to draw rectangular shapes, Point to define vertices, Sequence to generate lists or dotted grid lines, and Circle for auxiliary geometry. A chooser/slider interface controls base and height parameters, while text objects display real-time area and perimeter values; dottedhorizontals and dottedverticals provide visual grid support. Suitable for upper elementary and middle school mathematics instruction, classroom demonstrations, and independent student exploration of rectangular measurement properties.
GeoGebra Commands & Parameters
Sequence((x(A) + (unitsize * i), y(A)), i, 1, base) → list1Sequence((x(A) + (unitsize * i), y(A) + (height * unitsize)), i, 1, base) → list2Sequence((x(A), y(A) + (unitsize * i)), i, 1, height) → list3Sequence((x(A) + base, y(A) + (unitsize * i)), i, 1, height) → list4Polygon(A, Element[list1, base], Element[list2, base], Element[list3, height]) → poly1, a, b, c, dCircle(B, unitsize) → fPoint(f) → CCircle(C, unitsize) → gPolygon(B, C, 4) → poly2, h, i, j, k, D, ESequence(Segment[(x(A), y(A) + (unitsize * i)), (x(A) + (base * unitsize), y(A) + (unitsize * i))], i, 0, height) → dottedhorizontalsSequence(Segment[(x(A) + (unitsize * i), y(A)), (x(A) + (unitsize * i), y(A) + (height * unitsize))], i, 0, base) → dottedverticals
AI Drawing Prompt Reference
Create a rectangle whose base and height can be adjusted with sliders, allowing the shape to resize dynamically. Inside the rectangle, draw a dotted grid of equally spaced horizontal and vertical lines to serve as a measurement guide. Display the current area and perimeter values next to the rectangle, updating in real time as the dimensions change. Add small circles at the rectangle’s corners or along the edges to help locate points for measurement. Ensure the construction includes both the solid rectangle outline and the auxiliary dotted lines, providing a clear visual representation of how area and perimeter vary with side lengths.
The prompt above was compiled from the original drawing commands and is for reference only.