
3D Fourier Transform Visualization by Patrick Clément
Loading the math board and drawing, please wait…
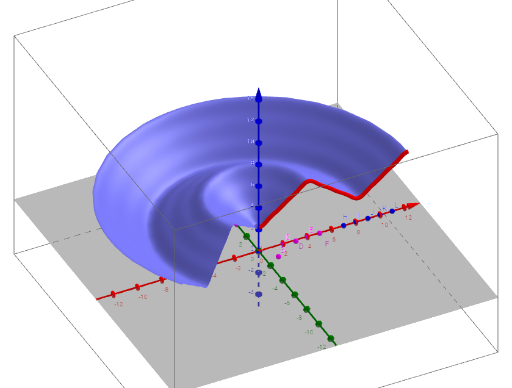
This example visualizes 3D Fourier transforms. It involves Fourier series and 3D geometry. Using commands like PointIn, Sequence, Surface, and CurveCartesian, complex 3D shapes can be constructed. Suitable for university mathematics and related researchers and learners.
GeoGebra Commands & Parameters
PointIn(x + (0 * z) = 1) → BPointIn(x + (0 * z) = 2) → CPointIn(x + (0 * z) = 3) → DPointIn(x + (0 * z) = 4) → EPointIn(x + (0 * z) = 7) → HPointIn(x + (0 * z) = 8) → IPointIn(x + (0 * z) = 9) → JPointIn(x + (0 * z) = 10) → KPointIn(x + (0 * z) = 11) → LPointIn(x + (0 * z) = 5) → FPointIn(x + (0 * z) = 0) → ASequence((k + 6, ((-1)^(k + 1) * 2 / k)), k, 1, 5) → dentSequence((k, (2 / ((π * k^(2))) * (cos((k * π)) - 1))), k, 1, 5) → triSequence((i, (6 / ((i * π)) * sin((i * π / 2)))), i, 1, 5) → crenSurface((u * cos(v)), (u * sin(v)), f(u), u, 0, (eu * T), v, 0, ev) → sCurveCartesian(t, 0, f(t), t, 0, (eu * T)) → dCurveCartesian(t, f(t), t, 0, (eu * T)) → c
AI Drawing Prompt Reference
Create a 3D visualization of a Fourier transform. First, create 10 points on the x-axis with coordinates 1, 2, 3, 4, 5, 7, 8, 9, 10, and 11, and one point at 0. Then, draw a series of triangular, sawtooth, and cosine curves, which will serve as the basis for the 3D surface. Finally, use these curves and points to create a 3D surface and two 3D curves.
The prompt above was compiled from the original drawing commands and is for reference only.