
线性回归斜率t检验
几何画板及绘图内容加载中,请稍等……
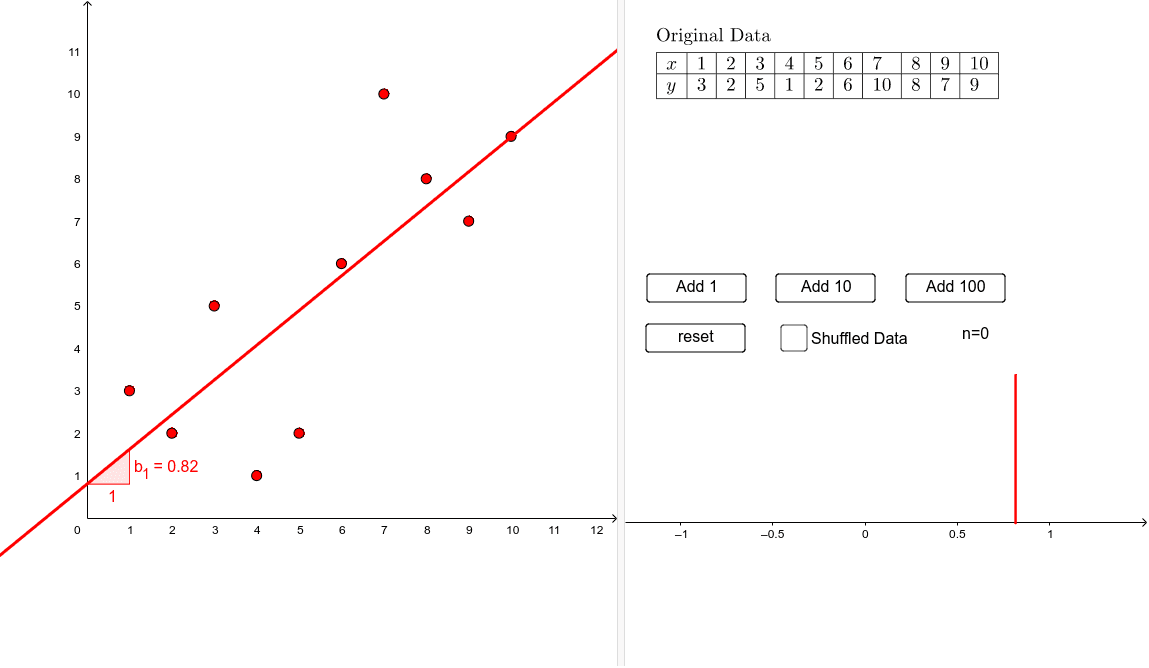
本范例演示了线性回归斜率t检验的图形现象。涉及的核心数学概念包括线性回归、假设检验、斜率计算等。作图要点使用了GeoGebra的Shuffle, Sequence, FitLineY, TableText, Slope, Segment, DotPlot, If等命令和对象。适合高中及以上数学学习者和研究者使用。
GeoGebra 命令及参数
Shuffle(ycoor) → list3, {5, 10, 7, 6, 9, 1, 2, 8, 3, 2}Sequence((Element[xcoor, i], Element[list3, i]), i, 1, Length[xcoor]) → list1FitLineY(list1) → fSequence((Element[xcoor, i], Element[ycoor, i]), i, 1, Length[xcoor]) → list2FitLineY(list2) → gTableText({Append["x", xcoor], Append["y", ycoor]}, "l_|h") → text1TableText({Append["x", xcoor], Append["y", list3]}, "l_|h") → text2Slope(f) → b_{ 1}Slope(g) → b_1FitLineY(list1) → hSegment((b_1, 0), (b_1, 1)) → iDotPlot(slopedata, true, 1) → list4If(Length[slopedata] < 5, slopedata, Take[slopedata, Length[slopedata] - 4, Length[slopedata]]) → list5