
探索 y=mx+b 与直线关系
几何画板及绘图内容加载中,请稍等……
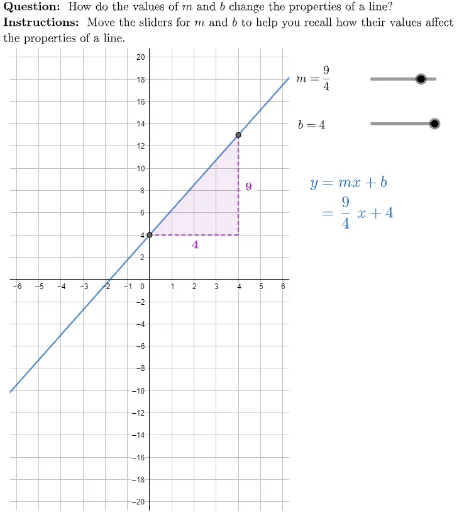
本范例演示了直线方程 y=mx+b 与直线图像之间的关系。通过交互式操作,用户可以直观理解斜率 m 和截距 b 对直线位置和方向的影响。涉及的核心数学概念包括一次函数、斜率、截距和线性方程。作图要点使用了 GeoGebra 命令 Polygon, UnicodeToLetter, Numerator, Denominator, LaTeX, If 等,通过滑块动画展示直线的动态变化。适合初中及以上学生用于学习解析几何和函数图像。
GeoGebra 命令及参数
Polygon((-6.3, -20.8), (-6.3, 20.8), (6.3, 20.8), (6.3, -20.8)) → viewBox, g, h, i, jUnicodeToLetter(10007) → xmarkUnicodeToLetter(10003) → cmarkNumerator(m) → riseDenominator(m) → runLaTeX("\text{\textbf{Question: } How do the values of \(m\) and \(b\) change the properties of a line?\\\textbf{Instructions: } Move the sliders for \(m\) and \(b\) to help you recall how their values affect\\the properties of a line.}") → TEXTPolygon(intercept, point2, (x(point2), y(intercept))) → t1, hypotenuse, riseLine, runLineLaTeX(("b=" * b)) → bCaptionLaTeX(rise) → riseLabelLaTeX(run) → runLabelIf(rise < 0, (-0.2, 1.3), (-0.2, -0.2)) → runOffsetLaTeX(("\vphantom{\dfrac{1}{2}}m=" * NumToImproperFrac[m])) → mCaption
AI 绘图提示语参考
画一个坐标系,背景是矩形框,中心有一条直线,通过两个滑块控制直线的斜率和截距。直线与坐标轴围成的三角形中,用不同颜色标示出斜率的上升和运行部分,并在旁边标注出斜率和截距的具体数值,同时显示一个问句引导观察直线性质的变化。
以上提示语为根据原始绘图命令整理而来,仅供参考。