
估算两位数乘积的几何探索
几何画板及绘图内容加载中,请稍等……
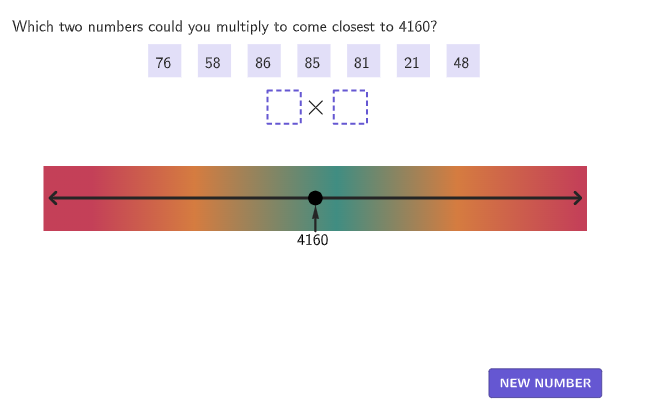
这个范例通过GeoGebra动态演示如何寻找两位数乘积最接近目标值的数对。核心数学概念是估算与最值优化。作图要点包括使用Sequence、Shuffle、Min、Max等命令生成随机数对,并通过distanceProducts计算乘积距离。适合小学四年级至五年级学生,用于理解估算策略和几何直观。
GeoGebra 命令及参数
Sequence((allSelections(A, 1) * allSelections(A, 2)), A, 1, Length[allSelections]) → allSelectedProducts, {}Shuffle(Remove[Sequence[2, 99], {10, 20, 30, 40, 50, 60, 70, 80, 90}]) → possibleNumbers, {99, 69, 56, 88, 93, 91, 2, 4, 24, 82, 31, 5, 61, 53, 76, 58, 86, 85, 81, 21, 48, 94, 23, 75, 95, 16, 51, 66, 32, 59, 6, 72, 39, 18, 98, 52, 11, 77, 3, 67, 37, 8, 14, 84, 25, 45, 83, 54, 22, 28, 9, 36, 15, 13, 68, 62, 96, 17, 7, 63, 35, 46, 43, 64, 71, 55, 42, 78, 73, 49, 92, 33, 57, 44, 47, 34, 38, 41, 26, 87, 27, 65, 19, 74, 12, 97, 89, 79, 29}Sequence(Element[possibleNumbers, Mod[randomIndex + A, Length[possibleNumbers]] + 1], A, 1, 7) → currentNumbersRemoveUndefined(Flatten[Sequence[Sequence[If[i < j, (allNums(i) * allNums(j))], i, 1, 7], j, 1, 7]]) → possibleProductsMin(possibleProducts) → productLowestMax(possibleProducts) → productHighestMax(expectedProduct - productLowest, productHighest - expectedProduct) → displayRangeZip(If[abs((expectedProduct - A) / displayRange) > 0.75, 1, If[abs((expectedProduct - A) / displayRange) > 0.35, 2, 3]], A, allSelectedProducts) → colorIndexZip(abs(expectedProduct - A), A, possibleProducts) → distanceProductsElement(possibleProducts, IndexOf[Min[distanceProducts], distanceProducts]) → closestProductShuffle(Sequence[1, 7]) → randomIndex2, {6, 1, 3, 4, 2, 7, 5}Element(randomIndex2, Mod[countQuestion, Length[randomIndex2]] + 1) → index2TmpShuffle(Sequence[1, 7]) → randomIndex1, {5, 3, 4, 7, 1, 6, 2}Element(randomIndex1, Mod[countQuestion, Length[randomIndex1]] + 1) → index1If(index1 ≟ index2Tmp, Mod[index1 + 1, Length[randomIndex2]] + 1, index2Tmp) → index2Zip(If[abs((expectedProduct - A) / displayRange) > 0.75, colorSpectrum(1), If[abs((expectedProduct - A) / displayRange) > 0.35, colorSpectrum(2), colorSpectrum(3)]], A, allSelectedProducts) → allColorsSequence((((((If[highlightRow ≟ A, (("\textcolor{" * colorSpectrum(colorIndex(A))) * "}\fbox"), "\fbox\textcolor{#252525}"] * "{") * allSelections(A, 1)) * "\times") * allSelections(A, 2)) * "}"), A, 1, Length[allSelections]) → coloredDataShuffle({1, 1, 1, 1, 1, 1, 1, 1, 2, 2, 2, 2, 2, 2, 2, 2}) → randomIndices, {1, 1, 1, 2, 1, 2, 2, 2, 1, 2, 1, 2, 2, 1, 1, 2}Element(randomIndices, Mod[countQuestion + 2, Length[randomIndices]] + 1) → opIndex3Element(randomIndices, Mod[countQuestion + 1, Length[randomIndices]] + 1) → opIndex2Element(randomIndices, Mod[countQuestion, Length[randomIndices]] + 1) → opIndex1makeBox(Anchor2 + (((-1.2 * boxWidth)) / 2, boxHeight / 2), (1.2 * boxWidth), boxHeight) → region2Zip(IsInRegion[A, region2], A, allPoints) → countRegion2makeBox(Anchor1 + (((-1.2 * boxWidth)) / 2, boxHeight / 2), (1.2 * boxWidth), boxHeight) → region1Zip(IsInRegion[A, region1], A, allPoints) → countRegion1Shuffle(Sequence[1, 9]) → randomDigits5, {7, 8, 5, 4, 1, 3, 9, 6, 2}Shuffle(Sequence[1, 9]) → randomDigits4, {1, 6, 8, 5, 4, 3, 7, 9, 2}Shuffle(Sequence[1, 9]) → randomDigits3, {3, 9, 5, 1, 7, 6, 2, 4, 8}Shuffle(Sequence[1, 9]) → randomDigits2, {1, 3, 2, 8, 9, 7, 5, 4, 6}Shuffle(Sequence[1, 9]) → randomDigits1, {6, 9, 3, 2, 7, 4, 5, 8, 1}Zip(Join[{A, A}], A, {randomDigits1, randomDigits2, randomDigits3, randomDigits4, randomDigits5}) → allRandomTake(Element[allRandom, randomIndex], startIndex, startIndex + 4) → currentRandomsmakeBox(P5, boxWidth, boxHeight) → box5makeBox(P3, boxWidth, boxHeight) → box3makeBox(P2, boxWidth, boxHeight) → box2makeBox(P1, boxWidth, boxHeight) → box1Corner(5) → DimsmakeBox(Anchor2, boxWidth, boxHeight) → boxBmakeBox(Anchor1, boxWidth, boxHeight) → boxAMidpoint(Corner[2], Corner[1]) → PCentermakeBox(P7, boxWidth, boxHeight) → box7Zip(Text[("" * A), B + (boxHeight / 2 + 0.2, ((-boxWidth)) / 2), true, true, 0, 0], A, {num1, num2, num3, num4, num5, num6, num7}, B, {P1, P2, P3, P4, P5, P6, P7}) → digitTextSequence(HomeAnchor + (((A * 1.5) * boxWidth), 0), A, 0, 6) → homePointsSequence(If[countRegion1(A) ∧ (countEntries(1) ≟ 1 ∨ movedBox ≟ A), Anchor1, If[countRegion2(A) ∧ (countEntries(2) ≟ 1 ∨ movedBox ≟ A), Anchor2, homePoints(A)]], A, 1, 7) → allLocationsSegment(AnchorLine, AnchorLineEnd) → numberLineMin(possibleProducts) → minProductMax(possibleProducts) → maxProductSequence((((allSelectedProducts(A) - expectedProduct) / displayRange * lineLength / 2), 0), A, 1, Length[allSelectedProducts]) → allDisplayPointsVector((0, -5), (0, -1)) → vCorrectSequence(If[allSelectedProducts(A) ≟ closestProduct, (("\textcolor{" * colorTealSuccess) * "}{✓ }"), ""], A, 1, Length[allSelectedProducts]) → checksLength(allSelections) → numTriesText(("" * expectedProduct), PointN + (0, -7), false, true, 0, 0) → lblExpectedZip(abs(A - expectedProduct), A, allSelectedProducts) → allDistancesTranslate(Vector[(0, 5), (0, 0)], CurrentDisplayPoint + (0, 6)) → arrowCurrentmakeBox(P4, boxWidth, boxHeight) → box4makeBox(P6, boxWidth, boxHeight) → box6Flatten(Sequence[Sequence[AnchorFactors + ((i * 11.2), (j * (-5.3))), i, 0, 7], j, 0, 2]) → allFactorPointsZip(Text[("" * A), B, true, true, 1, 0], A, coloredData, B, allFactorPoints) → displayData
AI 绘图提示语参考
绘制一个数学可视化图形,展示如何找到两个两位数相乘最接近目标值的数对。图形包含一个滑动条控制目标值,随机生成多个两位数,并通过计算所有可能乘积来找到最接近目标值的乘积。用不同颜色标记最接近和最远的乘积,并用几何方式展示每个乘积与目标值的距离。最终图形应直观展示优化过程和几何直觉。
以上提示语为根据原始绘图命令整理而来,仅供参考。