
Statistics Keywords & Definitions Demo
Loading the math board and drawing, please wait…
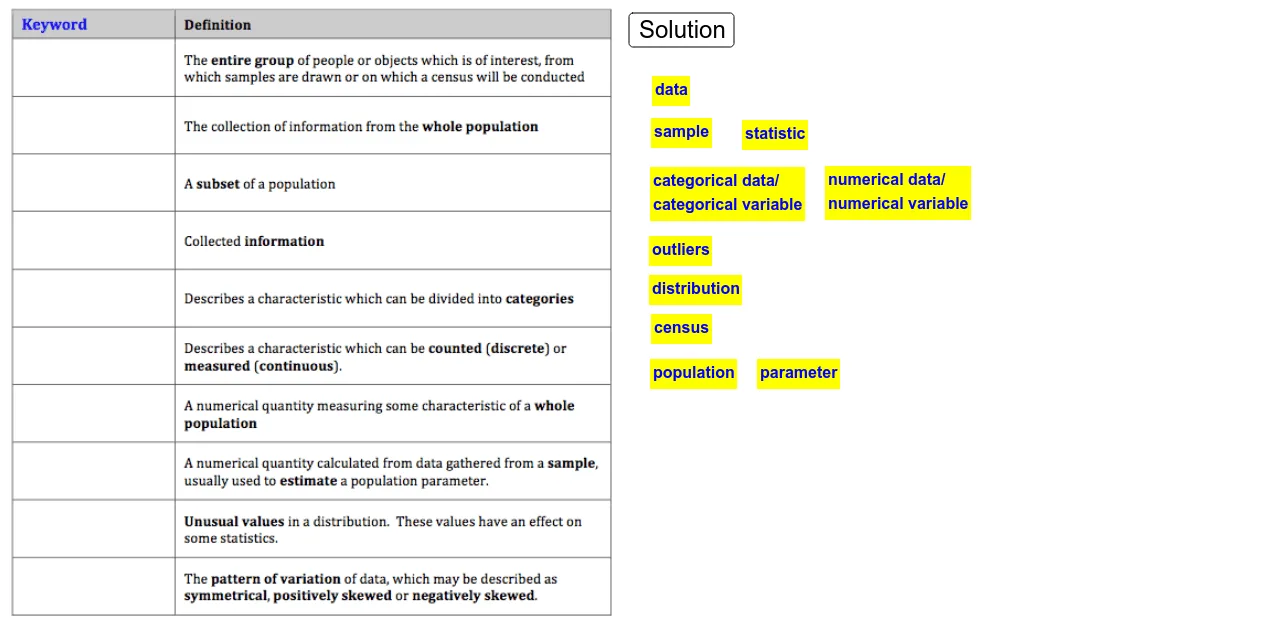
This example demonstrates the visualization of common statistical keywords and definitions. It involves core math concepts like Probability & Statistics, Derivative, Polynomial Functions, and Normal Distribution. Constructed using GeoGebra commands such as text1, text1_1 to text1_9, C, D, pic1, A to L, and button1. Suitable for high school students and math enthusiasts for learning and reviewing statistical knowledge.
GeoGebra Commands & Parameters
Point C(-4.12, -6.1)Point D(8.04, -6.1)Point A(-3.22, 3.84)Point B(-3.2, 4.92)Point E(-3.26, 2.78)Point F(-3.32, 1.5)Point G(-3.44, 0.48)Point H(-3.4, -0.7)Point I(-3.5, -2.02)Point J(-3.48, -3.18)Point K(-3.5, -4.34)Point L(-3.5, -5.4)
AI Drawing Prompt Reference
Visualize common statistical keywords and definitions in a coordinate system, including probability, derivatives, polynomial functions, and normal distribution. Use points and lines to represent a normal distribution curve, and label different terms with distinct shapes and colors above the curve, creating a clear and educational layout for learning statistical concepts.
The prompt above was compiled from the original drawing commands and is for reference only.