
Polynomial Addition Demonstration
Loading the math board and drawing, please wait…
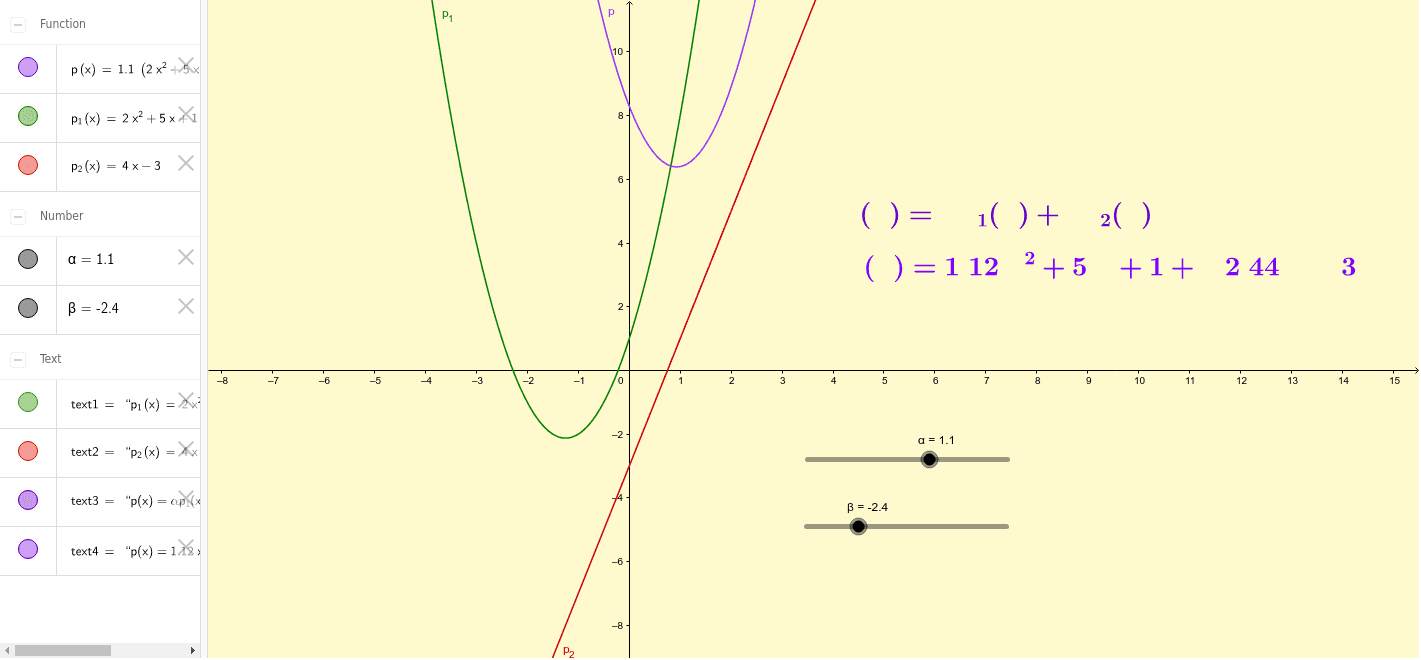
This example visually demonstrates polynomial addition by showing the graphs of two polynomial functions and their sum function. Core mathematical concepts include polynomial functions, function graphs, geometric representation, and algebraic operations. Constructed using GeoGebra commands like LaTeX for text display and objects such as p_1, p_2, text1, α, β, p, text3, text2, text4 to build and display polynomial functions and their sum. Suitable for high school students learning and understanding the concept of polynomial addition, serving as an educational demonstration tool.
GeoGebra Commands & Parameters
LaTeX(p_1, true, true) → text1LaTeX(p_2, true, true) → text2
AI Drawing Prompt Reference
Create an educational diagram demonstrating polynomial addition. Show two smooth curves representing two distinct polynomial functions, and a third curve representing their sum. Use different colors for each curve and include mathematical expression labels nearby. Place a slider below or beside the graph to dynamically adjust coefficients of one polynomial, visually showing how the sum changes. The layout should be clear and suitable for high school students to understand polynomial graphs and algebraic operations.
The prompt above was compiled from the original drawing commands and is for reference only.