
Limits, Rates of Change, and Tangent Lines
Loading the math board and drawing, please wait…
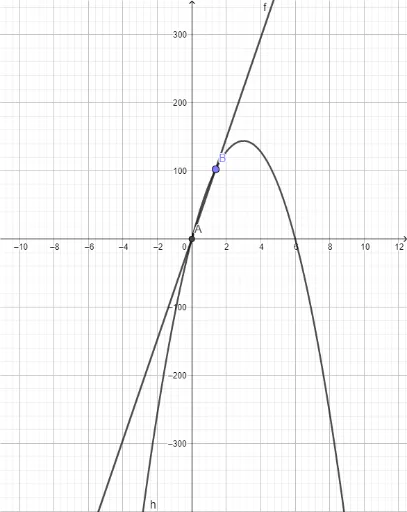
This GeoGebra example dynamically illustrates the relationship between limits, average rates of change, and tangent lines. It shows a function curve with a fixed point A and a moving point B; as B approaches A along the curve, the secant line through A and B gradually becomes the tangent line at A, revealing the geometric meaning of the derivative. Core mathematical concepts include limits, difference quotients (rates of change), and the definition of a tangent line. The construction uses the Intersect command to find intersection points, Point to create dynamic points, and Line to draw the secant line, with a slider h controlling the horizontal distance between A and B to animate the transition. This is suitable for high school or introductory college calculus students to grasp the intuitive foundation of derivatives, and also serves as an effective classroom demonstration tool.
GeoGebra Commands & Parameters
Intersect(h, xAxis, 1) → APoint(h) → BLine(B, A) → f
AI Drawing Prompt Reference
Draw a function curve with a fixed point and a moving point along the curve. As the moving point approaches the fixed point, draw a line through both points, which gradually becomes the tangent line at the fixed point, illustrating how average rates of change approach the derivative. Use a slider to control the horizontal distance between the moving point and the fixed point to animate the transition, demonstrating the geometric relationship between limits, rates of change, and tangent lines.
The prompt above was compiled from the original drawing commands and is for reference only.