
IM 6.7.9 Lesson: Solutions of Inequalities
Loading the math board and drawing, please wait…
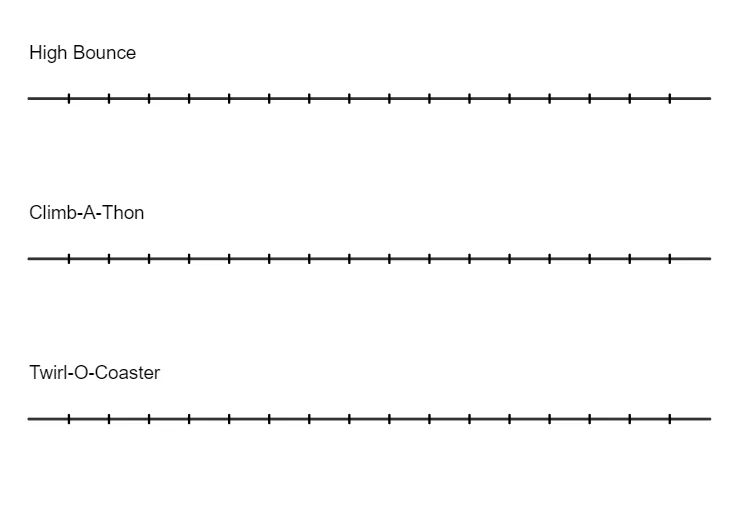
This GeoGebra example demonstrates the graphical approach to solving inequalities, providing a visual representation of solution sets. Key mathematical concepts involved include inequalities, solution sets, number line interpretation, and the graphing of linear inequalities. The construction utilizes commands such as Sequence to create sequences of points, Segment to draw line segments, Translate for translating objects, and Zip to combine elements; objects like line l1, function f1, points A and B, and functions f2 and f3 are employed to illustrate the inequality regions. It is suitable for middle or high school mathematics education, serving as a teaching aid for inequality topics.
GeoGebra Commands & Parameters
Sequence(Segment[(i, -0.1), (i, 0.1)], i, 1, 16) → l1, {0.2, 0.2, 0.2, 0.2, 0.2, 0.2, 0.2, 0.2, 0.2, 0.2, 0.2, 0.2, 0.2, 0.2, 0.2, 0.2}Segment((0, 0), (17, 0)) → f1Translate(f1, A) → f2Translate(f1, B) → f3Translate(l1, A) → l2Translate(l1, B) → l3Zip(Text[t, p + (0, 1)], t, {"Twirl-O-Coaster", "Climb-A-Thon", "High Bounce"}, p, {(0, 0), A, B}) → l4