
Hole 9: Inequalities, Unit Circle, and Parametric Curves
Loading the math board and drawing, please wait…
In collections
GeoGolf
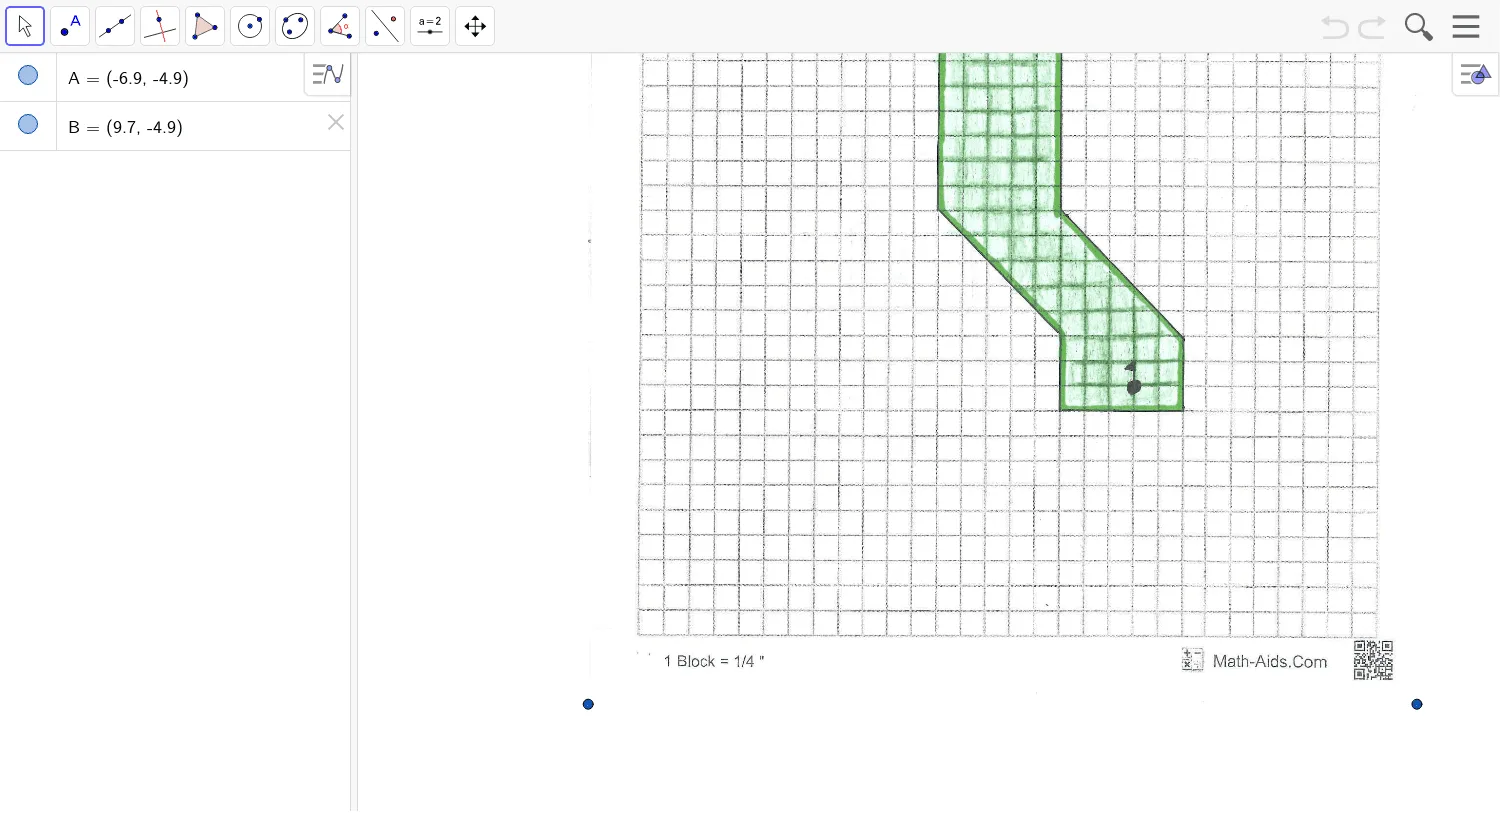
This interactive GeoGebra example, titled 'Hole 9', demonstrates the interplay between inequalities, numbers, the unit circle, difference and slope, and parametric curves. It constructs points A and B along with an image pic1, likely representing dynamic points on the unit circle or related numerical values. The parametric curves trace the motion of these points, while inequality regions highlight the set of points satisfying given conditions. Core mathematical concepts include the unit circle definition, parametric equations, inequality regions, difference and slope (rate of change between two points), and numerical comparisons. The construction uses GeoGebra's point tools to create A and B, parametric curve commands to generate dynamic paths, and inequality commands to plot constraint regions, all integrated into a single visual display. This example is suitable for high school or early college students to explore the combined applications of trigonometry, parametric equations, and inequalities in geometry. It serves as an excellent resource for classroom demonstrations or self-directed learning.
GeoGebra Commands & Parameters
Point A(-6.896, -4.894000000000002)Point B(9.6784, -4.894000000000002)
AI Drawing Prompt Reference
Draw two points A and B on the unit circle, with coordinates A(-6.896, -4.894) and B(9.6784, -4.894). Use parametric curves to trace the motion of these points and inequality regions to show the set of points satisfying certain conditions. Display the unit circle definition, parametric equations, inequality regions, and the difference and slope between two points.
The prompt above was compiled from the original drawing commands and is for reference only.