
Graphing Complex Functions
Loading the math board and drawing, please wait…
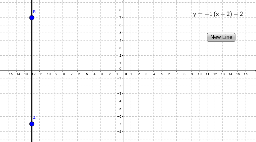
This example demonstrates how to graph complex functions in GeoGebra, including line segments, circles, hypergeometric distributions, and complex numbers. The core math concepts involved are function graphing, line segments, circles, hypergeometric distribution, complex numbers, and logic. Key GeoGebra commands and objects used include Line, Slope, FractionText, Simplify, If, and objects like C, D, a, m, text1, f, g, h, text2, text3, text4, A_1, button1, A, B, b, text5. It is suitable for high school students and teachers for teaching and exploring the properties of complex function graphs.
GeoGebra Commands & Parameters
Line(D, C) → aSlope(a) → mFractionText(m) → text1Simplify(x - x(C)) → fSimplify(x + y(C)) → gIf(y(C) ≥ 0, text2, text3) → text4Line(A, B) → b