
Graphical Limit Definition of a Derivative: Difference Quotient and Tangent
Loading the math board and drawing, please wait…
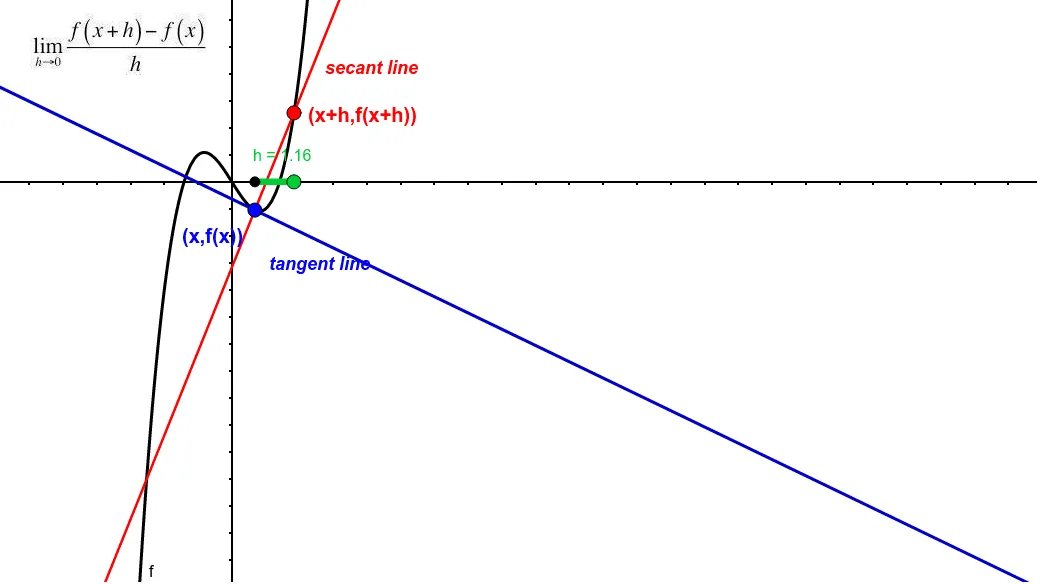
This GeoGebra example visually demonstrates the limit definition of a derivative by showing how the difference quotient (secant slope) approaches the tangent slope as the increment h tends to zero. The core mathematical concept is the derivative as the instantaneous rate of change, defined as the limit of the average rate of change over an interval. Construction details: using GeoGebra commands Point, Tangent, Line, and Segment, the applet places a movable point A on a function curve and a fixed point B, with a slider h controlling the horizontal distance. It dynamically draws the secant line (segment AB) and the tangent line at A, while displaying the difference quotient expressions (text1-text4) and their numerical values. This interactive tool is suitable for high school or introductory college calculus students to grasp the geometric transition from secant to tangent, and serves as an effective classroom demonstration or self-study resource.
GeoGebra Commands & Parameters
Point(f) → ATangent(A, f) → aPoint(xAxis) → BLine(A, C) → bSegment(D, B) → h
AI Drawing Prompt Reference
Draw a function curve with a movable point on it and a fixed point elsewhere. Use a slider to control the horizontal distance between the two points, dynamically showing the secant line connecting them and the tangent line at the movable point. Display the numerical values of the secant slope (difference quotient) and the tangent slope, illustrating how the secant approaches the tangent as the distance shrinks to zero. Include coordinate axes, the curve, two points, a secant line, a tangent line, a slider, and related text labels.
The prompt above was compiled from the original drawing commands and is for reference only.