
Function Zeros and Axis Intersections Examination
Loading the math board and drawing, please wait…
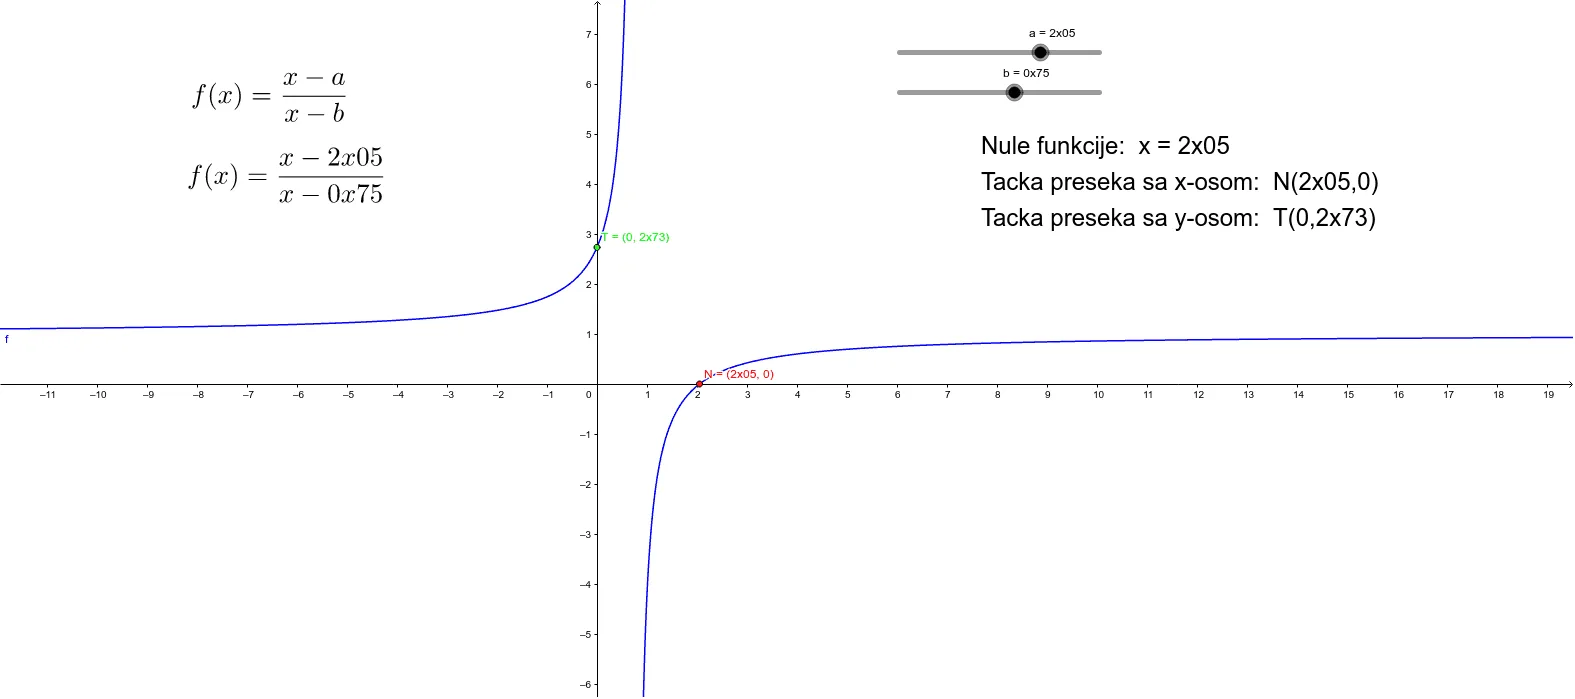
This example demonstrates the dynamic relationship between a function's graph, its zeros, and its intersections with coordinate axes. Core math concepts include function, zeros, axis intersections, and coordinate geometry. Construction highlights involve GeoGebra commands/objects like a, b, f, N, T, c, text1, etc., for plotting, calculating intersections, and annotations. Suitable for high school mathematics teaching, focusing on function properties and visualization.
GeoGebra Commands & Parameters
Numeric a(2.05)Numeric b(0.75)f(x) = (x - a) / (x - b)(a, 0)(0, f(0))f(0)
AI Drawing Prompt Reference
Draw a function graph defined by two sliders, showing its intersections with the x-axis and y-axis. The graph should dynamically change as the sliders move, and the intersection points should update accordingly. Label the x-axis and y-axis intersections, and display the function's value at the origin.
The prompt above was compiled from the original drawing commands and is for reference only.