
Fraction Size
Loading the math board and drawing, please wait…
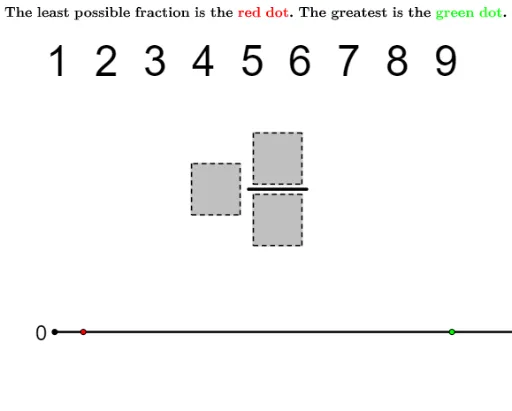
This example demonstrates the relationship between fractions. It involves key mathematical concepts such as fractions, numbers, and arithmetic mean. Using GeoGebra commands like Sequence, Text, and Midpoint, the example constructs fractions, numbers, and their relationships. Suitable for high-grade elementary and junior high school students to learn about fractions and comparison.
GeoGebra Commands & Parameters
Sequence(Element[fractions, i, 2], i, 1, Length[fractions]) → numsSequence(Element[fractions, i, 3], i, 1, Length[fractions]) → denomsSequence(Element[fractions, i, 1], i, 1, Length[fractions]) → wholesText(1) → text1Text(2) → text2Text(3) → text3Text(4) → text4Text(5) → text5Text(6) → text6Text(7) → text7Text(8) → text8Text(9) → text9Midpoint(Corner[text1, 1], Corner[text1, 3]) → point1Midpoint(Corner[text2, 1], Corner[text2, 3]) → point2Midpoint(Corner[text3, 1], Corner[text3, 3]) → point3Midpoint(Corner[text4, 1], Corner[text4, 3]) → point4Midpoint(Corner[text5, 1], Corner[text5, 3]) → point5Midpoint(Corner[text6, 1], Corner[text6, 3]) → point6Midpoint(Corner[text7, 1], Corner[text7, 3]) → point7Midpoint(Corner[text8, 1], Corner[text8, 3]) → point8Midpoint(Corner[text9, 1], Corner[text9, 3]) → point9Polygon(WholePolyStarter, WholePolyStarter + (polySize, 0), 4) → wholePoly, f, g, h, i, A, BPolygon(NumPolyStarter, NumPolyStarter + (polySize, 0), 4) → numPoly, j, k, l, m, C, DPolygon(DenomPolyStarter, DenomPolyStarter + (polySize, 0), 4) → denomPoly, n, p, q, r, E, FSegment(Midpoint[Vertex[numPoly, 1], Vertex[denomPoly, 4]] - (polySize / 10, 0), Midpoint[Vertex[numPoly, 2], Vertex[denomPoly, 3]] + (polySize / 10, 0)) → fractionLinePoint(Circle[FractionSegmentStarter, fractionSegmentLength]) → GZip(AAA + BBB / CCC, AAA, wholes, BBB, nums, CCC, denoms) → fractionSizesSegment(FractionSegmentStarter, G) → fractionSegmentSequence(Point[{(i * 1.1) - 0.2, 0}], i, 0, 8) → textAnchorsSort(fractions, fractionSizes) → sortedFractionsSequence(Text[(((((("$" * Element[sortedFractions, i, 1]) * "\frac{") * Element[sortedFractions, i, 2]) * "}{") * Element[sortedFractions, i, 3]) * "}$"), FractionSegmentStarter + ((Element[Sort[fractionSizes], i] / 17 * fractionSegmentLength) - 0.2, -0.65 + (2.05 * IsInteger[i / 2])), false, true], i, 1, Length[fractions]) → l1Sequence(Vector[FractionSegmentStarter + ((Element[Sort[fractionSizes], i] / 17 * fractionSegmentLength), -0.7 + (1.3 * IsInteger[i / 2])), FractionSegmentStarter + ((Element[Sort[fractionSizes], i] / 17 * fractionSegmentLength), 0)], i, 1, Length[fractions]) → l2Ray(FractionSegmentStarter, FractionSegmentStarter + (1, 0)) → s
AI Drawing Prompt Reference
Draw a diagram showing the relationship between fractions, including integers and their geometric representations as squares. Connect the numerators and denominators with lines, and display the fractions sorted by size at the bottom, with their specific values labeled.
The prompt above was compiled from the original drawing commands and is for reference only.