
Fraction, Decimal, and Percent on a 10×10 Grid
Loading the math board and drawing, please wait…
In collections
Percents, Decimals, Fractions
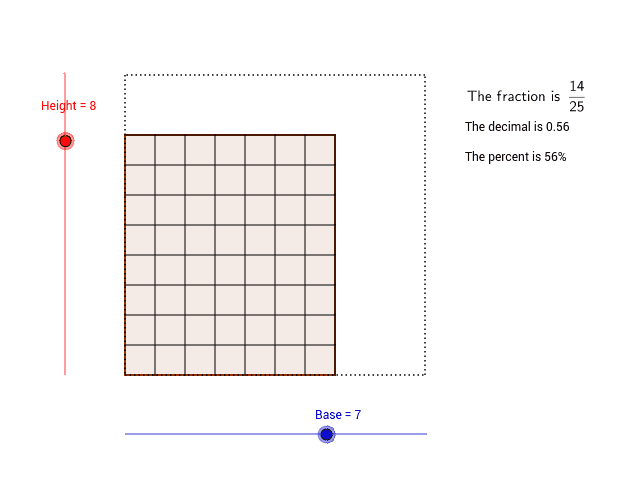
This GeoGebra example demonstrates filling cells in a 10 by 10 grid and instantly generating the equivalent fraction, decimal, and percent representations. It reinforces core mathematical concepts such as rational numbers, decimal notation, percentage meaning, and equivalence among fractions, decimals, and percents. The construction uses GeoGebra commands including Point, Segment, OrthogonalLine, Rotate, Intersect, Polygon, Line, and GCD, together with point objects such as A, B, C, D, E, F, G, H, I, J, K, L, M, N, O, P, Q, R and polygon/line elements to build an interactive hundredths grid. Suitable for upper elementary and middle school mathematics instruction, as well as independent exploration and visualization practice for percent and fraction concepts.
GeoGebra Commands & Parameters
Point(Circle[A, Base]) → BSegment(A, B) → aOrthogonalLine(A, a) → cPoint(Circle[A, Height]) → CSegment(A, C) → eRotate(A, 90.0*°, A) → A'Rotate(C, 90.0*°, A) → C'Segment(A', C') → fOrthogonalLine(B, a) → gOrthogonalLine(C', c) → hIntersect(g, h) → DSegment(C', D) → iSegment(D, B) → jPolygon(C', A, B, D) → P, c', a_1, b_1, d_1Line(E, F) → kIntersect(d_1, k) → GIntersect(a_1, k) → HSegment(G, H) → lLine(I, J) → mLine(K, L) → nLine(M, N) → pLine(O, Q) → qLine(R, S) → rLine(T, U) → sLine(V, W) → tLine(Y, Z) → c_1Line(A_1, B_1) → e_1Line(C_1, D_1) → f_1Line(E_1, F_1) → g_1Line(G_1, H_1) → h_1Line(I_1, J_1) → i_1Line(K_1, L_1) → j_1Line(M_1, N_1) → k_1Line(O_1, P_1) → l_1Line(Q_1, R_1) → m_1Intersect(d_1, m) → S_1Intersect(a_1, m) → T_1Intersect(d_1, n) → U_1Intersect(a_1, n) → V_1Intersect(d_1, p) → W_1Intersect(a_1, p) → Y_1Intersect(d_1, q) → Z_1Intersect(a_1, q) → A_2Intersect(d_1, r) → B_2Intersect(a_1, r) → C_2Intersect(d_1, s) → D_2Intersect(a_1, s) → E_2Intersect(d_1, t) → F_2Intersect(a_1, t) → G_2Intersect(d_1, c_1) → H_2Intersect(a_1, c_1) → I_2Segment(S_1, T_1) → n_1Segment(U_1, V_1) → p_1Segment(W_1, Y_1) → q_1Segment(Z_1, A_2) → r_1Segment(B_2, C_2) → s_1Segment(D_2, E_2) → t_1Segment(F_2, G_2) → a_2Segment(H_2, I_2) → b_2Intersect(c', e_1) → J_2Intersect(b_1, e_1) → K_2Intersect(c', f_1) → L_2Intersect(b_1, f_1) → M_2Intersect(c', g_1) → N_2Intersect(c', h_1) → O_2Intersect(c', i_1) → P_2Intersect(c', j_1) → Q_2Intersect(c', k_1) → R_2Intersect(c', l_1) → S_2Intersect(c', m_1) → T_2Intersect(b_1, g_1) → U_2Intersect(b_1, h_1) → V_2Intersect(b_1, i_1) → W_2Intersect(b_1, j_1) → Y_2Intersect(b_1, k_1) → Z_2Intersect(b_1, l_1) → A_3Intersect(b_1, m_1) → B_3Segment(J_2, K_2) → c_2Segment(L_2, M_2) → d_2Segment(N_2, U_2) → e_2Segment(O_2, V_2) → f_2Segment(P_2, W_2) → g_2Segment(Q_2, Y_2) → h_2Segment(R_2, Z_2) → i_2Segment(S_2, A_3) → j_2Segment(T_2, B_3) → k_2Segment(A, C_3) → bSegment(C_3, D_3) → dSegment(D_3, E_3) → l_2Segment(E_3, A) → m_2GCD(fracnumunred, fracdenomunred) → ReduceBy
AI Drawing Prompt Reference
Draw a 10x10 grid with some segments and polygons representing fractions, decimals, and percentages. Start by creating point A and point B, then create line segment a through A and B. Next, create a line c perpendicular to line segment a and create point C through A. Create line segment e through A and C, then rotate A 90 degrees to get A', rotate C 90 degrees to get C', and create line segment f through A' and C'. Then, create a line g perpendicular to line segment a and a line h perpendicular to line c, which intersect at point D. Create line segment i through C' and D, line segment j through D and B, and create polygon C'ABD. Continue creating other segments and polygons, ultimately forming a complex 10x10 grid with multiple segments and polygons representing the relationships between fractions, decimals, and percentages.
The prompt above was compiled from the original drawing commands and is for reference only.