
Exploring the gradients of straight lines
Loading the math board and drawing, please wait…
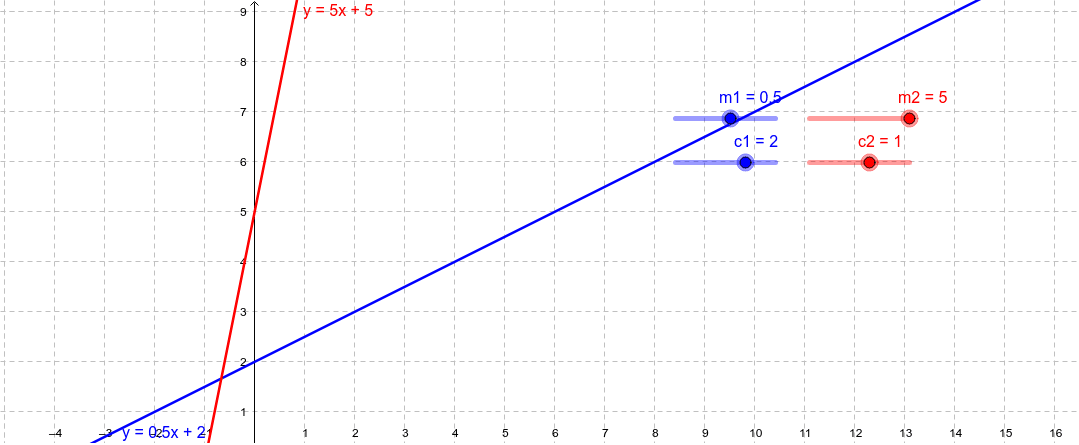
This example demonstrates the calculation and visualization of straight line slopes using GeoGebra. Key mathematical concepts include linear equations, slope definition, and continuity. Construction involves parameters like m1, c1, m2, c2, a, and b. Suitable for middle school students learning linear functions or geometry drawing.
GeoGebra Commands & Parameters
Numeric m1(0.5)Numeric c1(2)Numeric m2(5)Numeric c2(1)y = (m1 * x) + c1y = (m2 * x) + m2
AI Drawing Prompt Reference
Draw two straight lines. The first line has a slope of 0.5 and a y-intercept of 2. The second line has a slope of 5 and a y-intercept of 1. The lines intersect, forming a triangular region. Construct by drawing the first line, then the second line, and finally marking the intersection point.
The prompt above was compiled from the original drawing commands and is for reference only.