
Exploring Slope Between Two Points on a Parabola
Loading the math board and drawing, please wait…
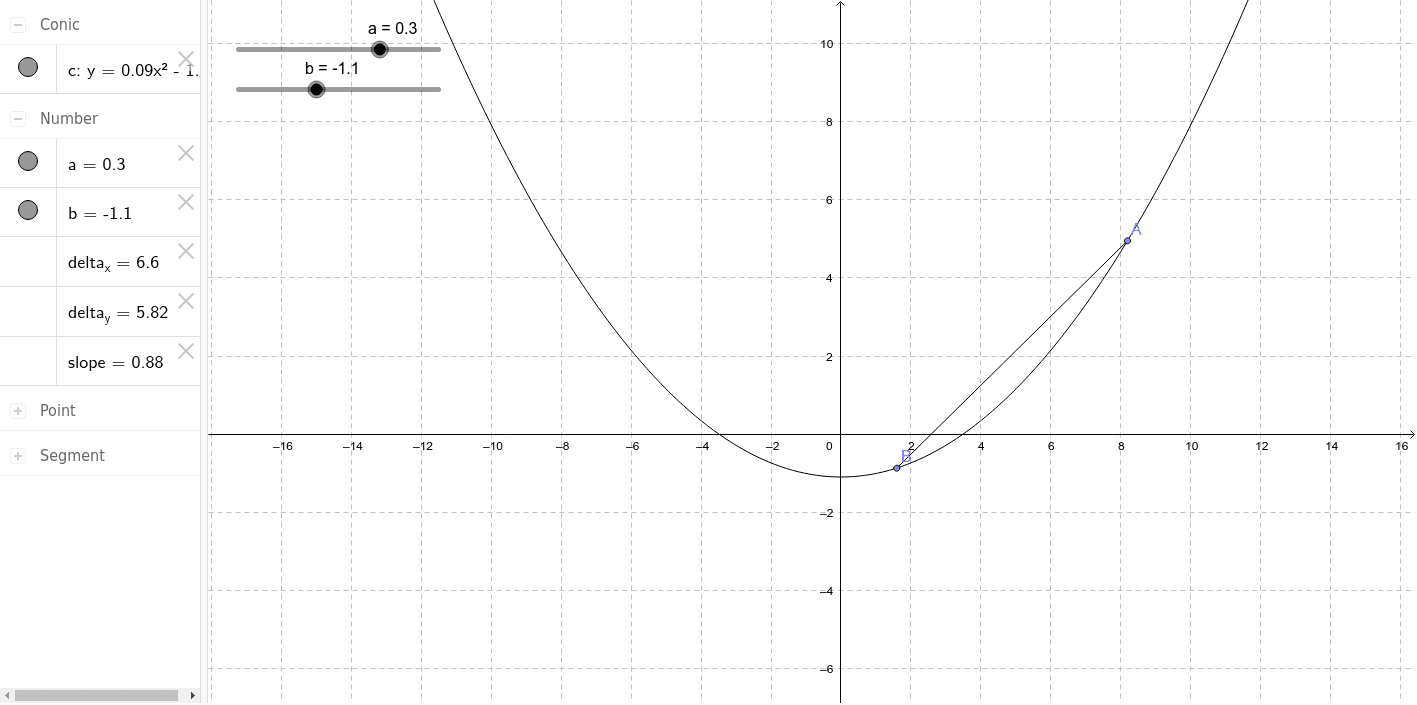
This example dynamically demonstrates the change in slope between two points on a parabola, helping students understand the concept of derivatives. By constructing points on the parabola and calculating the slope, students can intuitively grasp the definition of derivatives as a limit. The example uses commands like Point and Segment in GeoGebra, suitable for high school mathematics education.
GeoGebra Commands & Parameters
Point(c) → APoint(c) → BSegment(B, A) → d
AI Drawing Prompt Reference
Draw a parabola on a coordinate plane, mark two points on it, and connect these points with a line segment to illustrate the slope between them, demonstrating the concept of derivatives.
The prompt above was compiled from the original drawing commands and is for reference only.