
Exploring Parameters of Sine and Cosine Functions
Loading the math board and drawing, please wait…
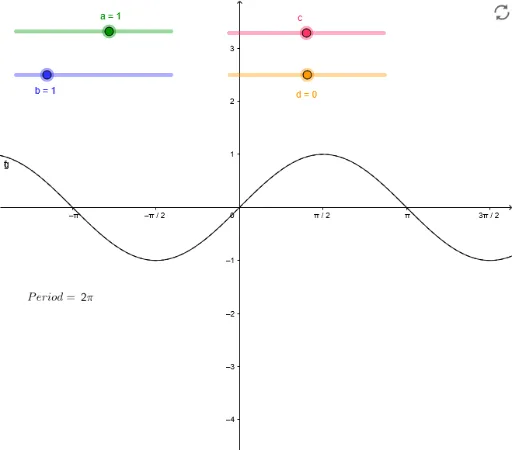
This example demonstrates the parameter changes of sine and cosine functions y=a*sin(b(x+c))+d and y=a*cos(b(x+c))+d. By adjusting the parameters, you can observe the changes in the function's graph. Key mathematical concepts include trigonometric functions, function transformations, and parametric equations. This example uses GeoGebra objects and commands such as functions, slider animations, and loci. Suitable for high school mathematics education and learning.
GeoGebra Commands & Parameters
f(x) = sin(x)Numeric a(1)Numeric c(0)Numeric d(0)Numeric b(1)g(x) = (a * sin((b * (x + (c * π / 4))))) + dh(x) = (a * cos((b * (x + (c * π / 4))))) + d2 / b
AI Drawing Prompt Reference
Draw the graphs of sine and cosine functions to show the effect of parameter changes. Start with the basic sine function, then add sliders for amplitude, phase, and vertical shift, and plot the transformed sine and cosine functions based on these parameters. Finally, display the relationship between amplitude and the reciprocal of parameter b.
The prompt above was compiled from the original drawing commands and is for reference only.