
Expectation Value Simulator: Spinner Probability Experiment
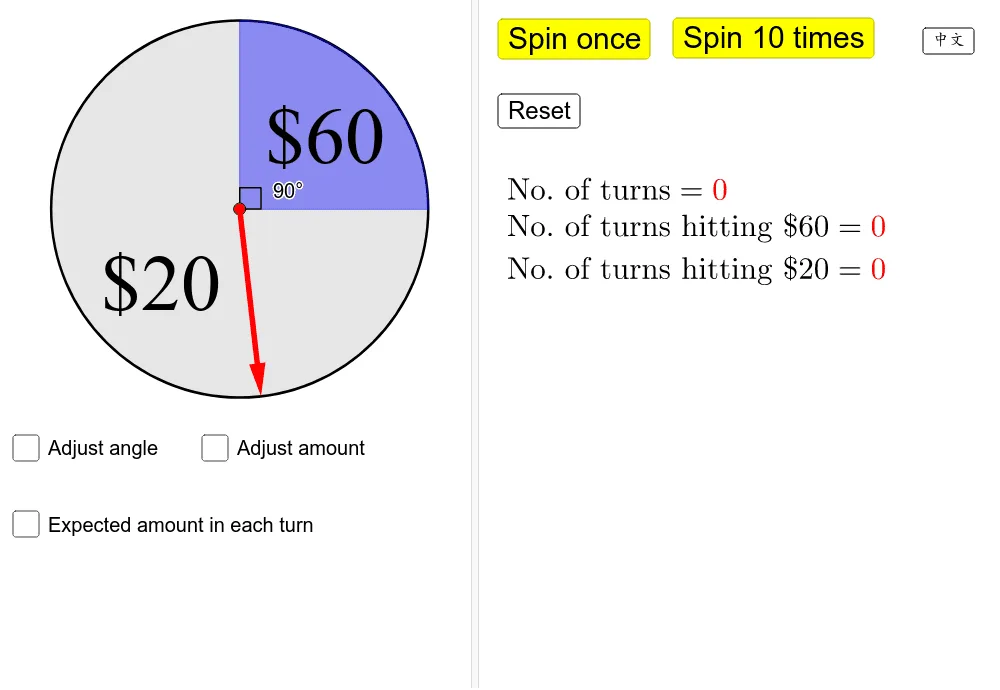
This GeoGebra applet, the Expectation Value Simulator: Spinner Probability Experiment, provides an interactive and visual approach to understanding the concept of expected value and the Law of Large Numbers in probability and statistics. At the center of the applet is a customizable circular spinner divided into various sectors. Users can modify the angles of these sectors to adjust the theoretical probabilities of each outcome, as well as assign specific monetary payoffs to each section. This flexibility allows students to design their own unique probability distributions and explore different risk and reward scenarios.
The simulation is driven by intuitive controls. Users can trigger a single spin or batch process ten spins at a time using dedicated buttons. With every spin, the applet automatically records the outcome, updates the frequency of each result, and calculates the corresponding payoff. Crucially, the system computes a running average of the empirical results in real time. As the number of trials increases, students can visually observe how this running average fluctuates initially and then gradually converges toward the theoretical expected value. This dynamic visualization perfectly illustrates the Law of Large Numbers, transforming an abstract statistical theorem into a tangible, observable phenomenon.
To support diverse learning environments and classroom activities, the applet includes input boxes for precise parameter customization, a reset button to clear all data and start fresh experiments, and a language toggle to switch seamlessly between English and Chinese interfaces.
For students, this tool bridges the gap between theoretical calculations and empirical data. Instead of merely calculating expected value using static formulas on paper, learners actively engage with the math by watching the sample mean evolve over hundreds of trials. It helps them answer fundamental questions in statistics, such as why a game of chance might be profitable in the long run despite short-term losses. By manipulating sector sizes and payoff values, students develop a deeper, intuitive grasp of probability distributions, expected value, and statistical convergence, making it an invaluable resource for high school and introductory college statistics courses.
Loading the math board and drawing, please wait…