
Effect of Base 'a' on the Graph of Exponential Functions
Effect of Base a on the Graph of Exponential Functions
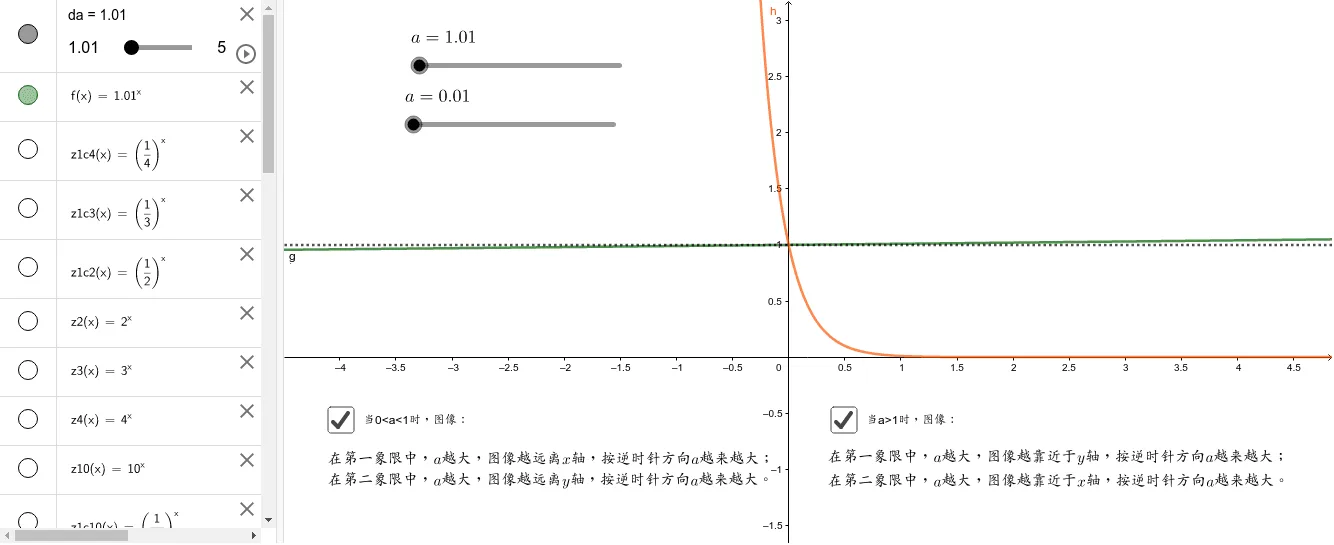
This GeoGebra applet dynamically demonstrates how the graph of the exponential function y = a^x changes as the base a varies. By adjusting the slider for a, users can visually observe that the function is monotonically increasing when a > 1 and monotonically decreasing when 0 < a < 1. It also highlights the geometric property that all exponential function graphs pass through the fixed point (0, 1), regardless of the value of a. This interactive tool allows students to explore the relationship between the algebraic form of an exponential function and its graphical representation in real time. Moving the slider back and forth helps learners internalize key properties such as asymptotic behavior toward the x-axis, the role of the base in determining growth or decay, and the universal y-intercept at (0, 1). The applet is designed to support student understanding of exponential function characteristics, including domain, range, monotonicity, and end behavior, making abstract concepts more tangible and accessible through hands-on exploration.
In collections
Vocational High School Mathematics
Loading the math board and drawing, please wait…