
Derivative and Quadratic Function Visualization
Loading the math board and drawing, please wait…
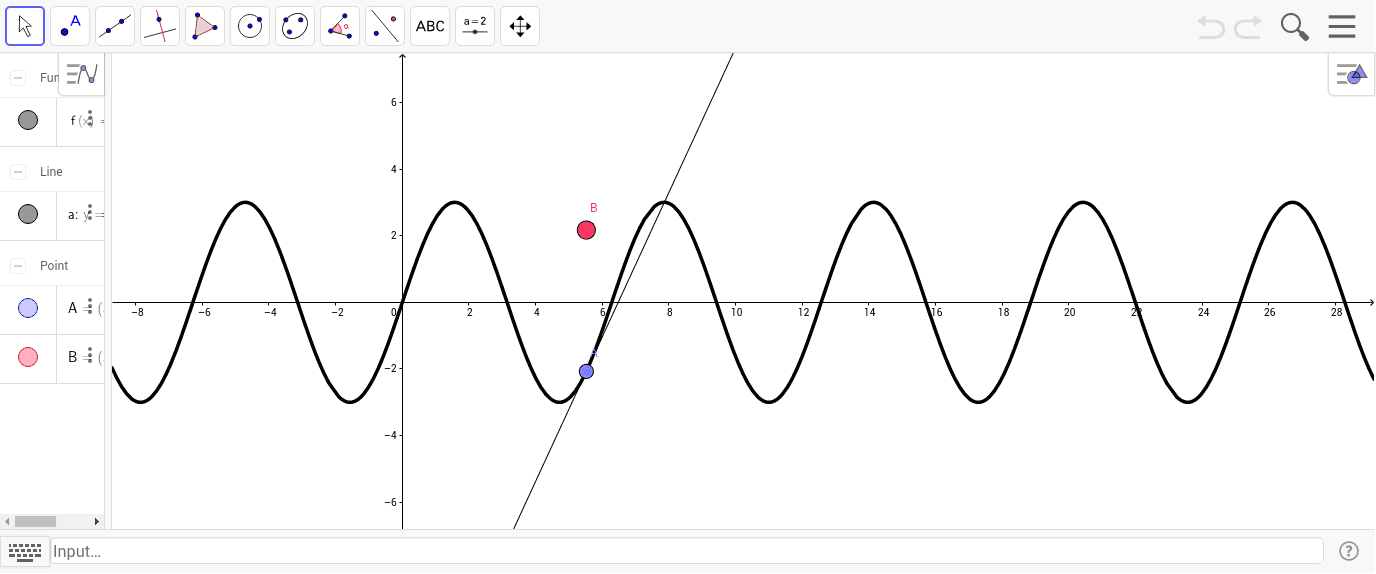
This example demonstrates how to use GeoGebra to plot the derivative of a function f and show the relationship between the tangent and the function graph. Core math concepts include derivatives, quadratic functions, tangent equations, and function graphs. Construction highlights involve using the Point command to create points and the Tangent command to draw tangents, with objects f, A, a, B. Suitable for high school mathematics teaching to help students understand the geometric meaning of derivatives and tangent drawing methods.
GeoGebra Commands & Parameters
Point(f) → ATangent(A, f) → a