
Cumulative Frequency Polygon and Histogram Analysis
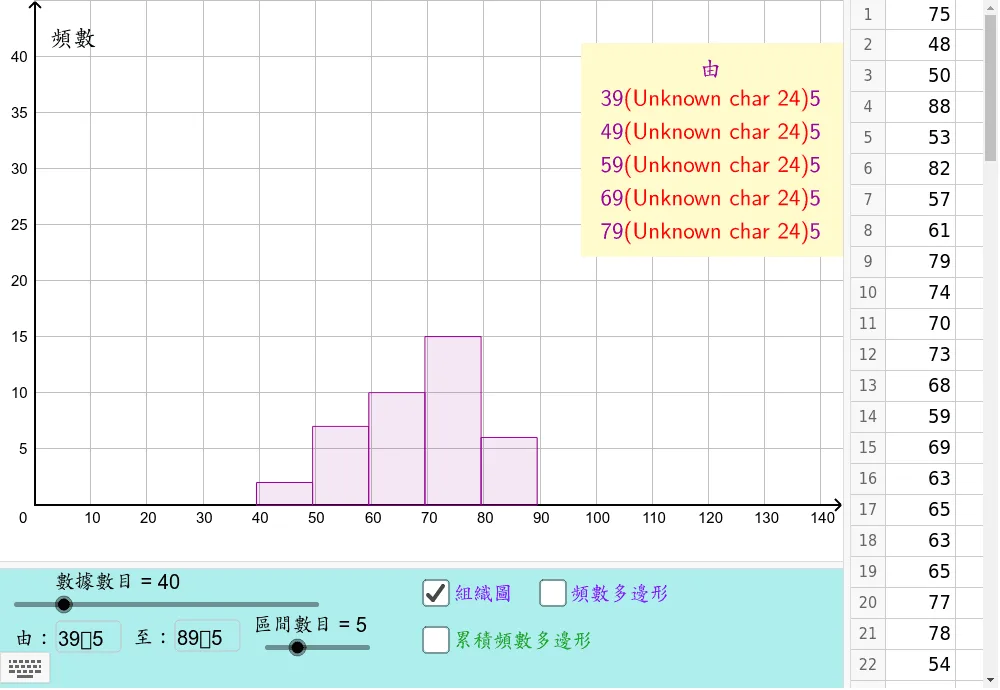
This GeoGebra applet demonstrates how to construct histograms and cumulative frequency curves (polygons) for analyzing data quartiles, including the first quartile (Q1), median (Q2), and third quartile (Q3). The applet allows users to visually plot a frequency distribution as a histogram and overlay the corresponding cumulative frequency polygon on the same graph. Through dynamic interaction, users can adjust the data or class intervals and observe in real time how the histogram and cumulative frequency polygon change, reinforcing the relationship between frequency distributions and their cumulative counterparts.
The applet guides learners through the process of reading quartile values directly from the cumulative frequency polygon. By tracing specific cumulative frequency levels—such as 25%, 50%, and 75% of the total frequency—users can identify Q1, Q2, and Q3 on the horizontal axis. This interactive approach helps students internalize the definitions of quartiles and understand how they divide a dataset into four equal parts.
Key features include the ability to manipulate class boundaries and frequencies dynamically, toggle the visibility of the histogram and polygon, and read precise coordinate values from the graph. These tools support exploratory learning, allowing students to test different data sets and immediately see how changes affect the shape of the distributions and the resulting quartile values.
The applet is designed for students studying introductory statistics and serves as an effective classroom demonstration tool. It bridges the gap between abstract statistical concepts and concrete visual representations, making it particularly useful for helping learners who struggle with traditional textbook examples. Teachers can use it to illustrate key topics such as grouped data analysis, cumulative frequency interpretation, and quartile estimation from continuous frequency distributions.
In collections
S2,3,5 Statistics
Loading the math board and drawing, please wait…