
Comprehensive Graphs of Trigonometric Functions
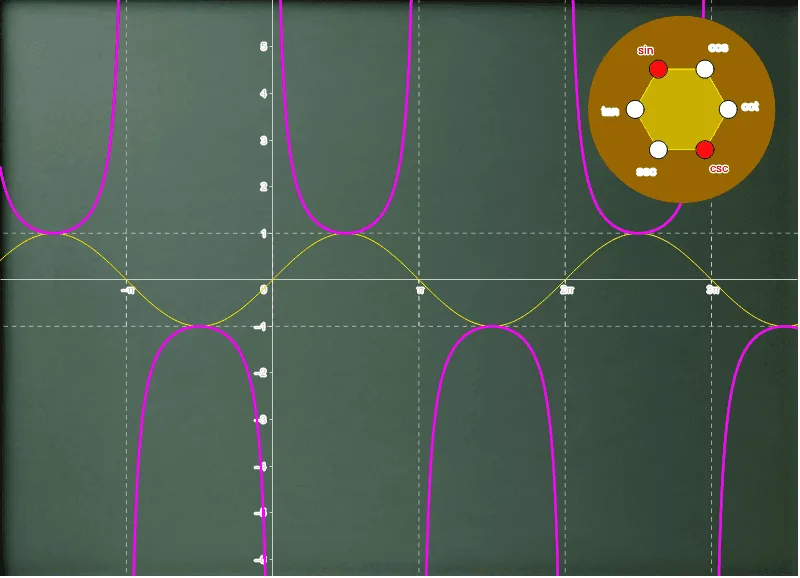
This interactive GeoGebra example dynamically visualizes the graphs of all six trigonometric functions: sine, cosine, tangent, cotangent, secant, and cosecant. It illustrates their geometric definitions using the unit circle and right triangles, emphasizing periodicity, symmetry, and asymptotic behavior. Constructed with key GeoGebra commands including Polygon, Sequence, and Circle, the model uses control objects (e.g., showSin, showCos) to toggle individual function displays. Points O, B, C and segments like vSeg and vLines series form the unit circle and reference triangles. Ideal for high school mathematics instruction, this tool bridges geometric intuition with analytic graphing of trigonometric functions.
Loading the math board and drawing, please wait…