
Comparing Values of Inverse Proportional Functions (Point-based Demonstration)
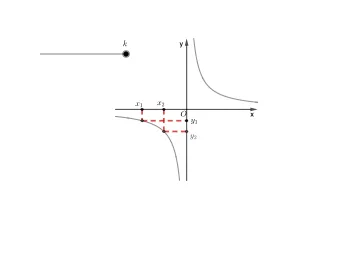
This GeoGebra math applet visually demonstrates how to compare the values of inverse proportional functions. Using commands such as Point, Intersect, and Segment, specific points are constructed on the graphs of inverse proportional functions. By comparing the coordinate positions of these points, the magnitude relationship of the function values can be determined. The applet also incorporates Vector, Mirror, and Text tools to dynamically display changes in function values corresponding to different independent variable inputs, enabling students to observe how function values vary as the independent variable changes across different quadrants. Through interactive geometric construction and dynamic manipulation, learners can intuitively grasp the monotonicity properties of inverse proportional functions — specifically that within each branch of the hyperbola, the function values increase or decrease monotonically depending on the sign of the proportionality constant. The visual comparison of point positions on the curve provides a concrete geometric interpretation of abstract inequality relationships between function values, reinforcing the connection between algebraic reasoning and graphical analysis. This pedagogical approach helps students develop a deeper conceptual understanding of inverse proportional functions beyond rote memorization of formulas, fostering mathematical reasoning skills through exploration and discovery.
In collections
Inverse Proportional Functions: Graphs & Properties
Loading the math board and drawing, please wait…