
Adjust Parameters of Binomial Distribution
Loading the math board and drawing, please wait…
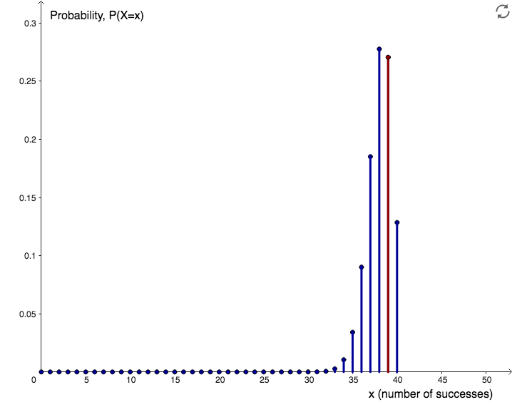
Change parameters to observe the changes in the binomial distribution. This example demonstrates the probability mass function of the binomial distribution, involving key mathematical concepts such as binomial distribution and probability & statistics. It uses GeoGebra objects and commands like sliders, sequences, points, and segments.
GeoGebra Commands & Parameters
Sequence(((Binomial[n, k] * p^(k)) * (1 - p)^(n - k)), k, 0, n) → sSequence((i, Element[s, i + 1]), i, 0, n) → pointsSequence(Segment[Element[points, i + 1], (i, 0)], i, 0, n) → segmentsElement(points, r + 1) → kPointSegment((r, 0), Element[points, r + 1]) → kSegSequence(((Binomial[n, k] * p^(k)) * (1 - p)^(n - k)), k, 0, n) → s_1Sequence((i, Element[s_1, i + 1]), i, 0, r) → points_1Element(points_1, r + 1) → kPoint_1Sequence(Segment[Element[points_1, i + 1], (i, 0)], i, 0, n) → segments_1
AI Drawing Prompt Reference
Draw a bar chart representing the probability mass function of a binomial distribution, with a slider to adjust parameters. Use points to mark probabilities and segments to connect them. Highlight a selected point with a vertical line to the x-axis, and fill the area under the bars with a light color to indicate the probability distribution.
The prompt above was compiled from the original drawing commands and is for reference only.