
Secant Lines and Areas in Exponential and Logarithmic Functions
This GeoGebra applet explores the geometric and algebraic properties of exponential and logarithmic functions. It constructs secant lines on function graphs, calculates their slopes, and visualizes areas of specific regions using vectors and sequences. The applet dynamically displays points, intersections, and shaded areas on the curves. Users can manipulate sliders to adjust parameters and observe how secant slopes change as points move along the graph, as well as how function terms evolve. This interactive visualization helps students connect the concept of average rate of change via secant lines to instantaneous rate of change through derivatives, reinforcing the geometric meaning of the derivative. It also illustrates definite integral area concepts by showing the region bounded between the curve and secant lines. The applet is well-suited for calculus and function graph analysis instruction, allowing learners to experiment with different parameter values and develop an intuitive understanding of exponential and logarithmic function behavior, their graphical characteristics, and the fundamental relationship between differentiation and integration.
In collections
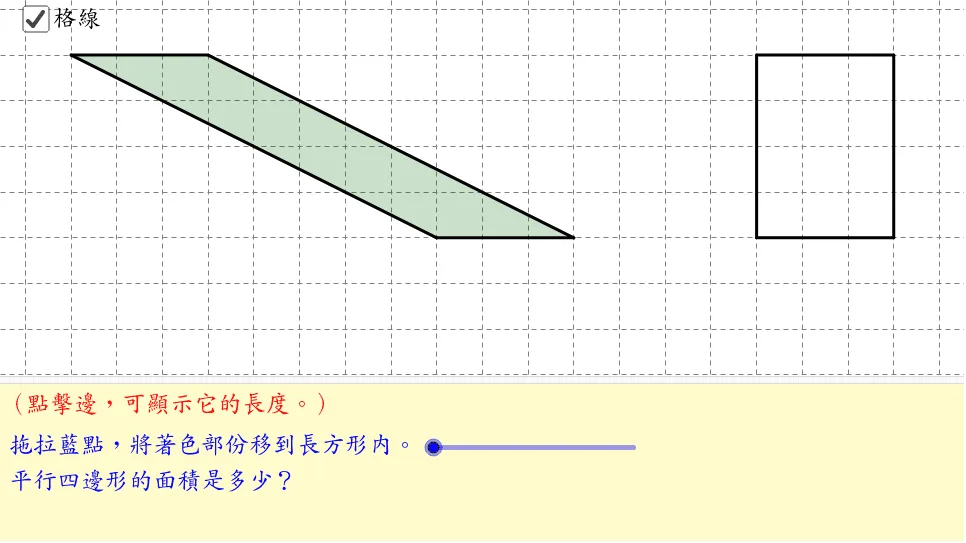
Exploring the Area of a Parallelogram
Loading the math board and drawing, please wait…