
Quiz on Quartiles and Box Plot
This interactive GeoGebra applet serves as a comprehensive quiz and practice tool focused on quartiles and box plots within the realm of descriptive statistics. Designed to bridge the gap between numerical calculation and visual data representation, the applet provides a dynamic environment for students to master the five-number summary and its graphical counterpart, the box-and-whisker plot.
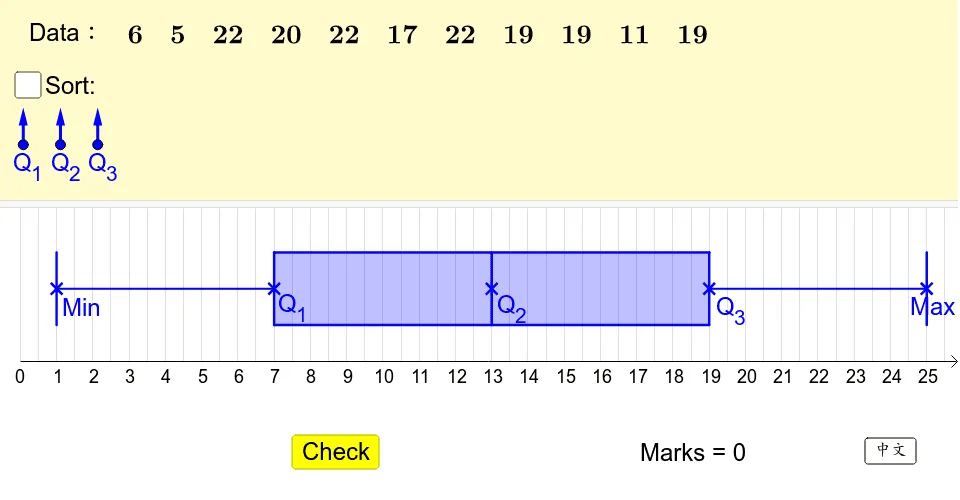
The core mechanics of the applet revolve around active student participation. Upon starting the quiz, the system randomly generates a unique dataset, ensuring that every practice session offers a fresh challenge and preventing rote memorization of answers. Students are tasked with analyzing this raw data to manually calculate essential statistical measures, specifically the minimum value, the first quartile, the median, the third quartile, and the maximum value. After computing these figures, users input their numerical answers into the designated fields. The interaction does not stop at calculation; students must then use these values to construct the actual box plot on a provided number line. This involves correctly positioning the whiskers, drawing the interquartile range box, and marking the median line, thereby translating abstract numbers into a concrete visual model.
A key feature of this educational tool is its instant feedback mechanism. As students input their calculated quartiles and manipulate the graphical elements of the box plot, the applet immediately evaluates their accuracy. If a student miscalculates a quartile or misplaces a whisker, the system promptly highlights the error. This immediate formative assessment allows learners to identify their misconceptions, review their step-by-step calculations, and correct their mistakes in real time, fostering a highly effective trial-and-error learning loop.
From a mathematical perspective, the applet deeply reinforces critical concepts in data analysis. It solidifies the understanding of measures of central tendency and measures of dispersion, with a strong emphasis on the interquartile range and data distribution. By forcing students to manually derive the quartiles and subsequently build the visual plot, the tool helps them develop an intuitive understanding of how the physical shape, symmetry, and spread of a box plot directly reflect the underlying characteristics of the dataset. Ultimately, this interactive quiz is an invaluable resource for middle and high school statistics students, offering a structured, engaging, and self-paced platform to build confidence and proficiency in foundational descriptive statistics before advancing to more complex analytical topics.
In collections
S2,3,5 Statistics
Loading the math board and drawing, please wait…