
Percentages and Geometric Relationship: Understanding Part-Whole through Graphic
Loading the math board and drawing, please wait…
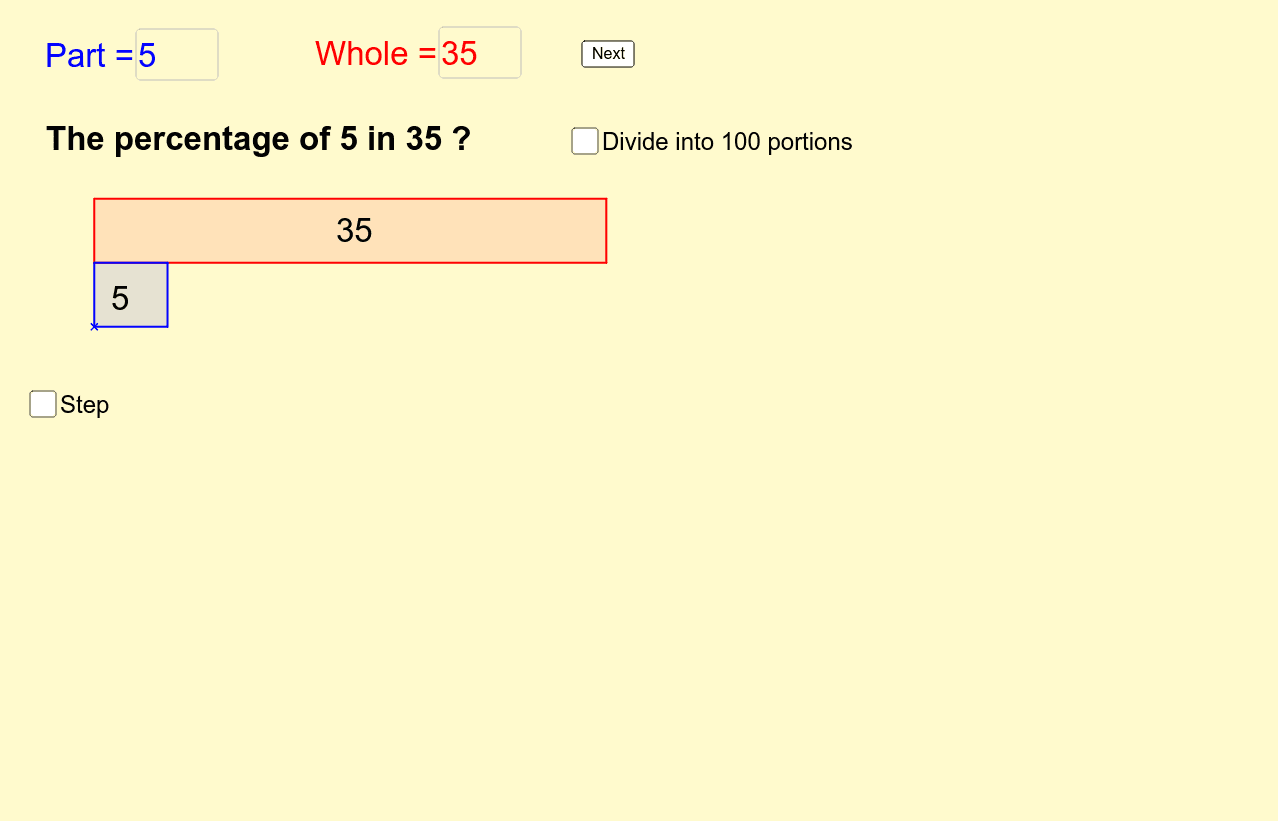
This example demonstrates the relationship between percentages and geometric shapes, originating from Alex Chik's mathematical ideas. Key concepts include geometric mean, standard deviation, median value, and pie or circle charts. Construction involves GeoGebra commands like Textfield, Polygon, Sequence, and others. Suitable for middle or high school mathematics to understand data visualization and geometric analysis.
GeoGebra Commands & Parameters
Textfield(b) → inputBox1Textfield(a) → inputBox2Polygon((0, 0), (l_a, 0), (l_a, 1), (0, 1)) → poly1, c, d, e, fPolygon(A, A + (l_b, 0), A + (l_b, 1), A + (0, 1)) → poly2, a_1, g, h, iSequence(Segment[((i * l_a / 100), 0), ((i * l_a / 100), 1)], i, 1, 99) → list1Sequence(Segment[((i * l_a / 10), 0), ((i * l_a / 10), 1)], i, 1, 9) → list2
AI Drawing Prompt Reference
Draw a figure consisting of two squares, where one square's side length is 10 times that of the other. In the smaller square, draw a grid of 9 equal segments, each 1/10th of the square's side length. In the larger square, draw a grid of 99 equal segments, each 1% of the square's side length. Use these segments to illustrate the percentage relationship between the side lengths of the squares.
The prompt above was compiled from the original drawing commands and is for reference only.