
Modular Surface Visualization of Complex Function 1/(1+z²)
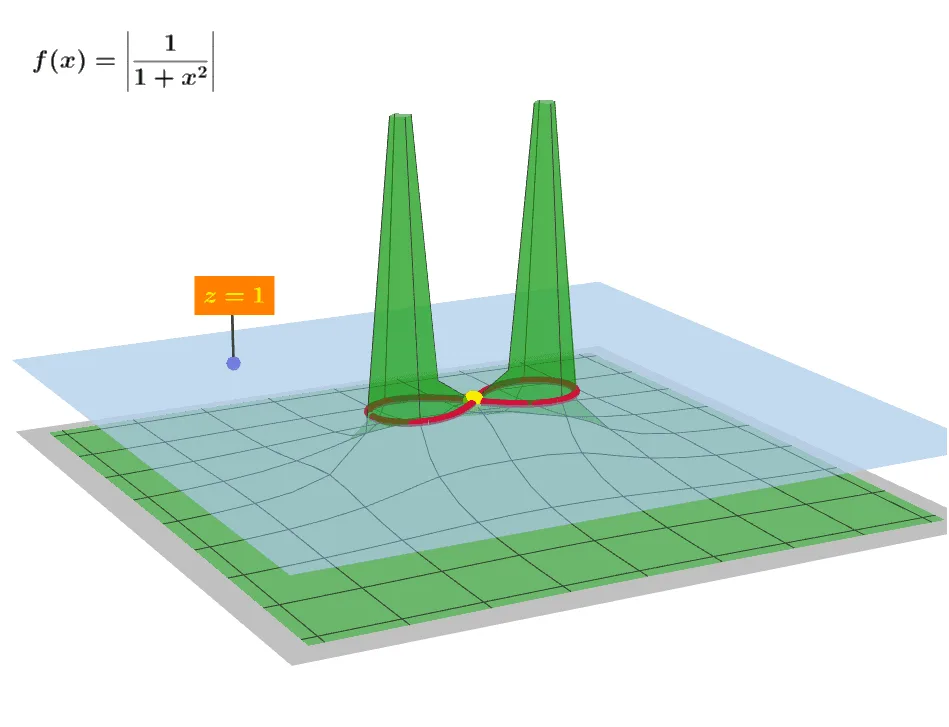
This GeoGebra applet provides a stunning and highly interactive three-dimensional visualization of the modular surface for the complex function f(z) = 1 / (1 + z^2). In complex analysis, graphing a function completely requires four dimensions because both the input and output are complex numbers. To overcome this visual limitation, the applet utilizes the modular surface technique, mapping the two-dimensional complex input plane to a three-dimensional space where the vertical height represents the absolute value, or modulus, of the function, denoted as |f(z)|. This approach transforms abstract algebraic expressions into tangible, easily comprehensible geometric landscapes.
The specific function explored in this applet, f(z) = 1 / (1 + z^2), is a classic example of a rational complex function with isolated singularities. The denominator equals zero when z^2 = -1, which occurs at the complex coordinates z = i and z = -i. On the modular surface, these poles manifest dramatically as two infinitely tall, steep spikes or volcanic peaks rising vertically from the complex plane. By rotating and zooming in on the 3D model, students can closely inspect the extreme gradients and asymptotic behavior near these singularities. Conversely, as the magnitude of z increases and moves far away from the origin, the value of the function approaches zero. This creates a wide, flat basin or skirt surrounding the central peaks, beautifully illustrating the function's decay at infinity. At the origin itself, where z = 0, the surface rests at a height of exactly one, providing a clear reference point for the modulus.
The interactive nature of the GeoGebra environment greatly enhances the learning experience. Users can freely rotate the three-dimensional surface to view it from any angle, allowing them to observe the rotational symmetry and overall topological features of the graph. They can zoom in to analyze the steep cliffs near the poles or zoom out to appreciate the global behavior of the function. Interactive elements also allow users to trace paths across the complex plane, dynamically observing how the height of the surface changes in real time as the complex variable moves.
For students and educators, this applet is an invaluable pedagogical tool. Complex analysis is often considered a challenging subject precisely because students struggle to build geometric intuition for functions of a complex variable. By providing a clear, visual representation of poles, moduli, and complex domains, this visualization bridges the gap between rigorous algebraic theory and spatial reasoning. It helps learners internalize the concept of singularities and understand the geometric implications of complex division. Ultimately, this applet serves as an excellent supplementary resource for university-level mathematics courses, making the transition from real-variable calculus to the rich, multidimensional world of complex analysis much more intuitive and engaging.
Loading the math board and drawing, please wait…