
Geometric Transformations of Trigonometric Functions
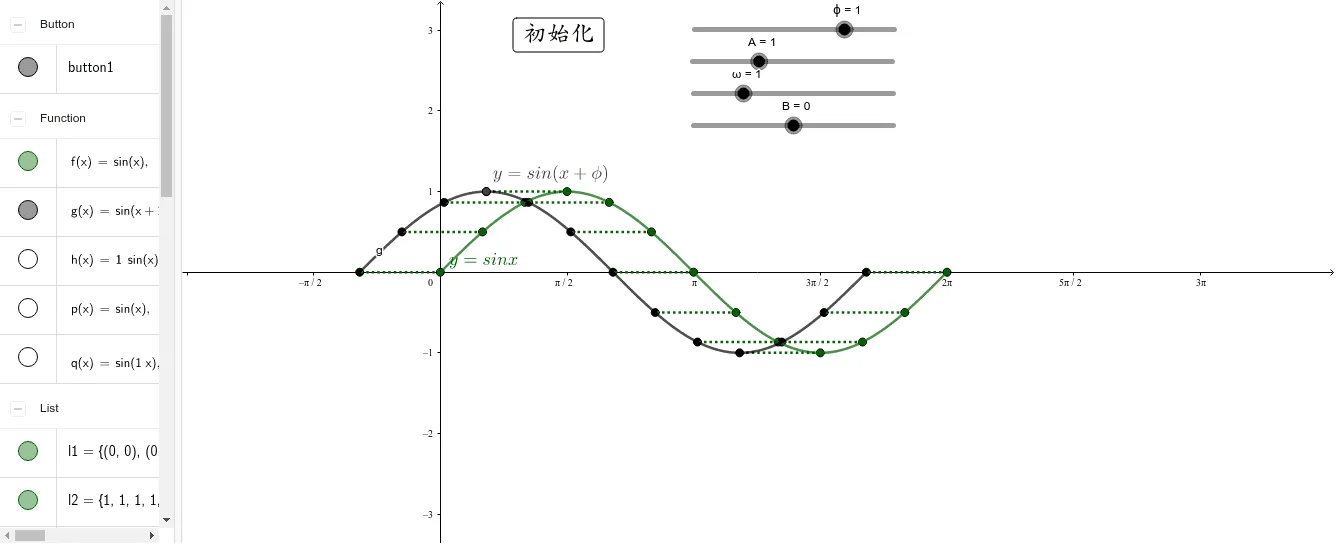
This GeoGebra applet visually demonstrates the geometric transformations of trigonometric function graphs. Utilizing the Translate and Sequence commands, users can observe how the graph of a function changes under different parameters, such as angular frequency omega and phase shift phi. The model includes multiple auxiliary lines and key points, combined with interactive buttons, to vividly illustrate the rules governing translations, stretches, and compressions of trigonometric function images. Students can manipulate parameters in real time and immediately see the effects on amplitude, period, phase shift, and vertical displacement. The applet provides an intuitive bridge between the algebraic form of a trigonometric function and its graphical representation, reinforcing the connection between symbolic expressions and geometric behavior. By exploring these transformations interactively, learners develop a deeper understanding of how each parameter influences the shape and position of sine, cosine, and related wave functions. The built-in sequence generation allows users to compare multiple transformed versions side by side, making it easy to identify patterns and generalize the rules of transformation. Key reference points, such as peaks, troughs, and intercepts, are highlighted throughout the animation, helping students track how specific features of the graph move as parameters change. This tool is especially valuable for classroom instruction or independent study, as it turns abstract algebraic manipulations into concrete visual experiences. Whether reviewing for an exam or introducing the topic for the first time, students gain confidence in predicting and interpreting the behavior of transformed trigonometric functions, laying a solid foundation for further study in precalculus, calculus, and analytic geometry.
Loading the math board and drawing, please wait…