
Functional Relationships and Locus Graphs in Dynamic Geometry
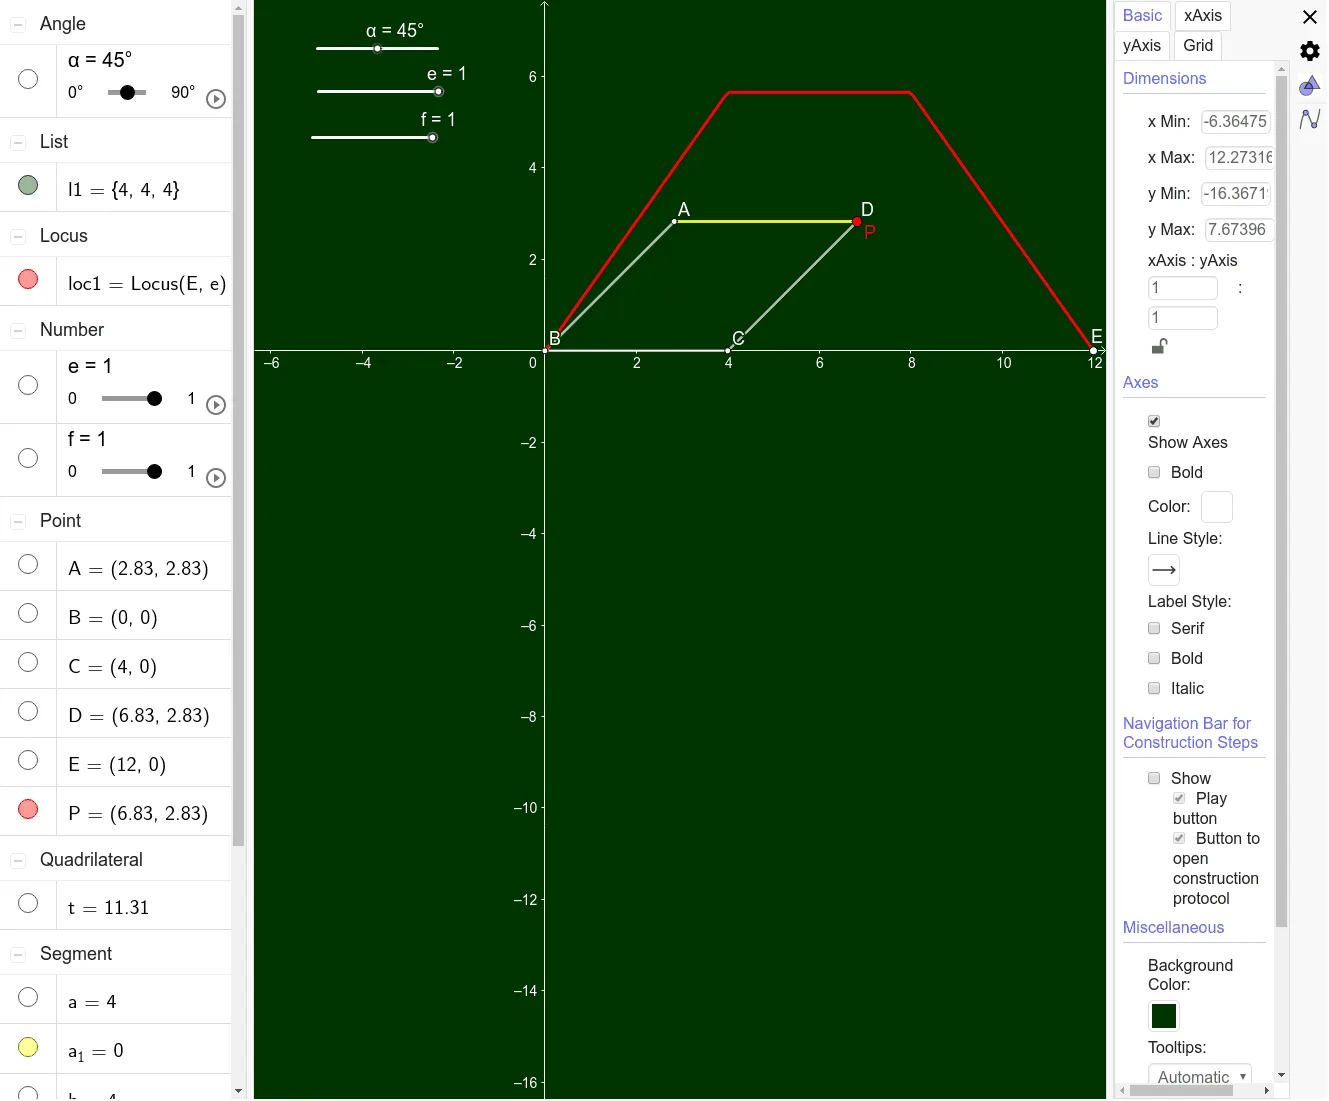
This GeoGebra example demonstrates how dynamic geometric constructions generate functional relationships and their corresponding graphs. Using commands such as Rotate, Polygon, Point, and Locus, it builds a polygon (e.g., a parallelogram) with vertices A, B, C, D and drives geometric transformations via parameter sliders (alpha, t, etc.). As dynamic elements move, the system automatically traces the trajectories of key points P and E, generating locus curves (loc1). This process transforms geometric motion into functional curves f, visually displaying the correspondence between dynamic geometry and function graphs. The example integrates analytic geometry, locus tracking, and function graphing, making it suitable for exploring function modeling problems under geometric transformations.
Students can manipulate the parameter sliders to observe in real time how changes in geometric parameters affect the shape of the function curve. This interactive approach helps learners develop an intuitive understanding of the connection between geometric transformations and algebraic representations. By dragging vertices or adjusting parameters, learners can see how specific geometric conditions produce particular function behaviors, reinforcing the link between visual-spatial reasoning and symbolic manipulation. The applet is particularly useful for lessons on coordinate geometry, parametric equations, locus problems, and the foundational concept that functions can arise naturally from geometric constraints. It serves both as an exploratory tool for students to discover patterns independently and as a demonstration aid for educators illustrating the deep relationship between geometry and functions in secondary mathematics education.
In collections
Minority Pi: Interactive Math Applets
Loading the math board and drawing, please wait…