
Dynamic Graphing of the Tangent Function
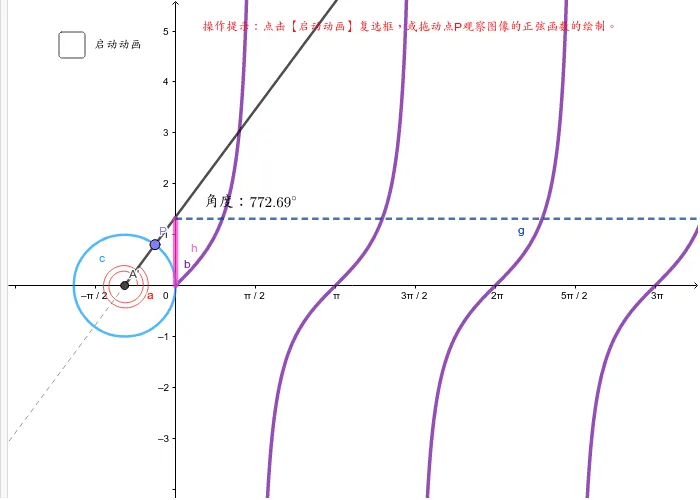
This GeoGebra applet dynamically demonstrates the graphing process of the tangent function y = tan(x). By combining geometric construction commands such as angles, rays, and Cartesian curves, it visually illustrates the correspondence between angle variations on the unit circle and tangent values. Users can interactively manipulate the angle, and the applet simultaneously updates the position of a point on the unit circle, a ray extending from the origin, and the corresponding point traced on the Cartesian plane. This real-time synchronization allows learners to see how each angle on the unit circle maps to a specific tangent value, making the abstract relationship between circular geometry and trigonometric functions tangible and intuitive. The interactive model helps students deeply understand the core properties of trigonometric functions, including their periodicity, the formation of vertical asymptotes, and the restrictions on the domain. Students can observe firsthand how the tangent function repeats every pi radians, how its values grow without bound as the angle approaches pi over two and three pi over two, and why the function is undefined at those exact points where cosine equals zero. This makes it an excellent visualization tool for studying trigonometric function graphs and their underlying properties, suitable for both classroom instruction and independent exploration.
In collections
Vocational High School Mathematics
Loading the math board and drawing, please wait…